The ECG Book
Part I · Foundations
Before a single abnormal tracing makes sense, you need three things: a mental picture of how the heart generates its signal, an understanding of what the twelve leads actually "see," and a fixed order in which you read every ECG. Master Part I and the rest of the book becomes pattern recognition on a solid frame.
1 · The heart's electrical system
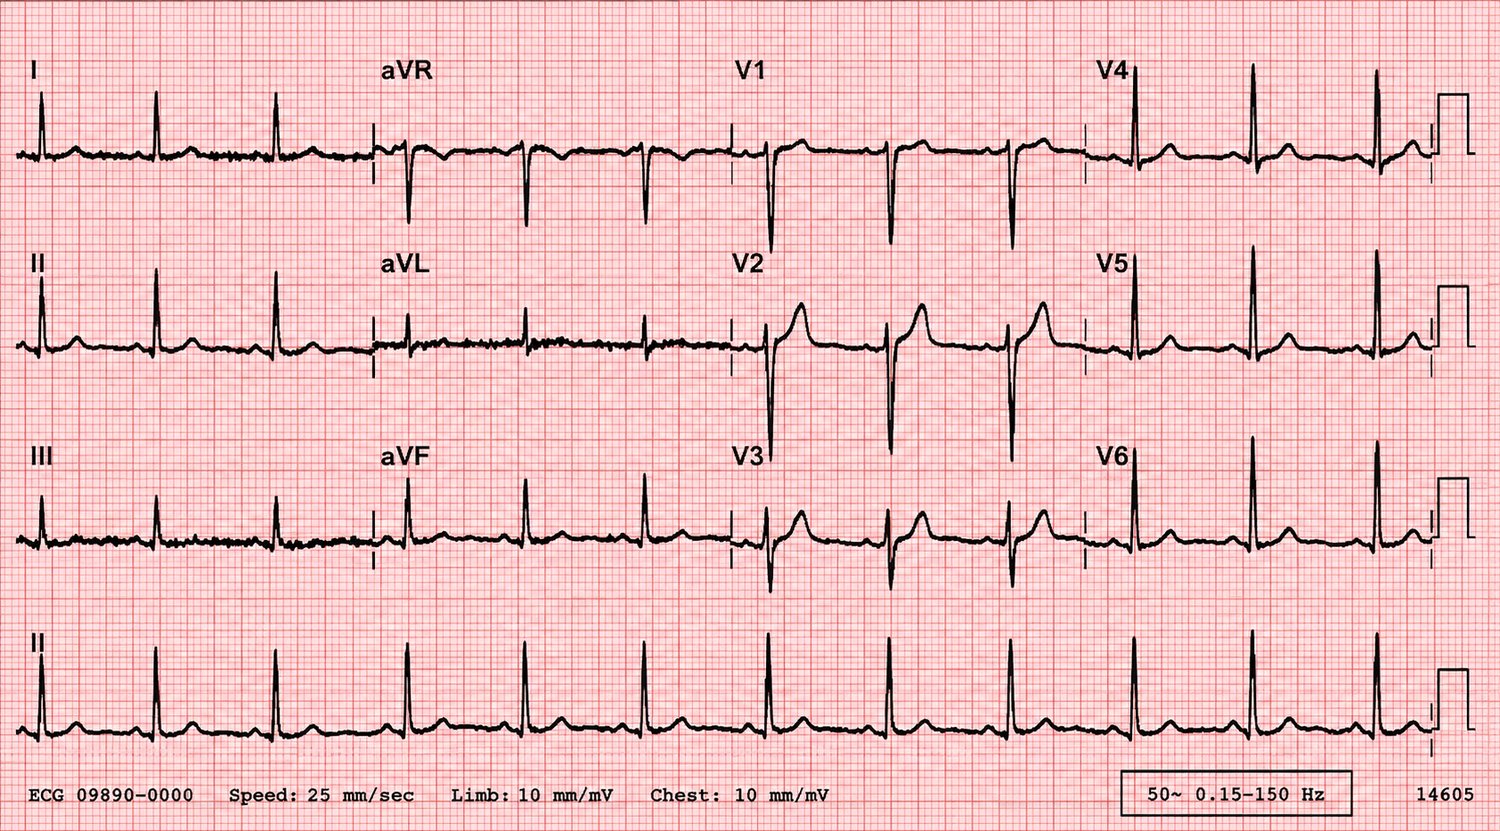
Every heartbeat begins as a wave of electrical depolarisation that sweeps through the myocardium in a fixed sequence. The ECG is simply a recording, from the body surface, of the summed voltage changes this wave produces. Understanding the sequence is the key to reading everything that follows.
The conduction pathway
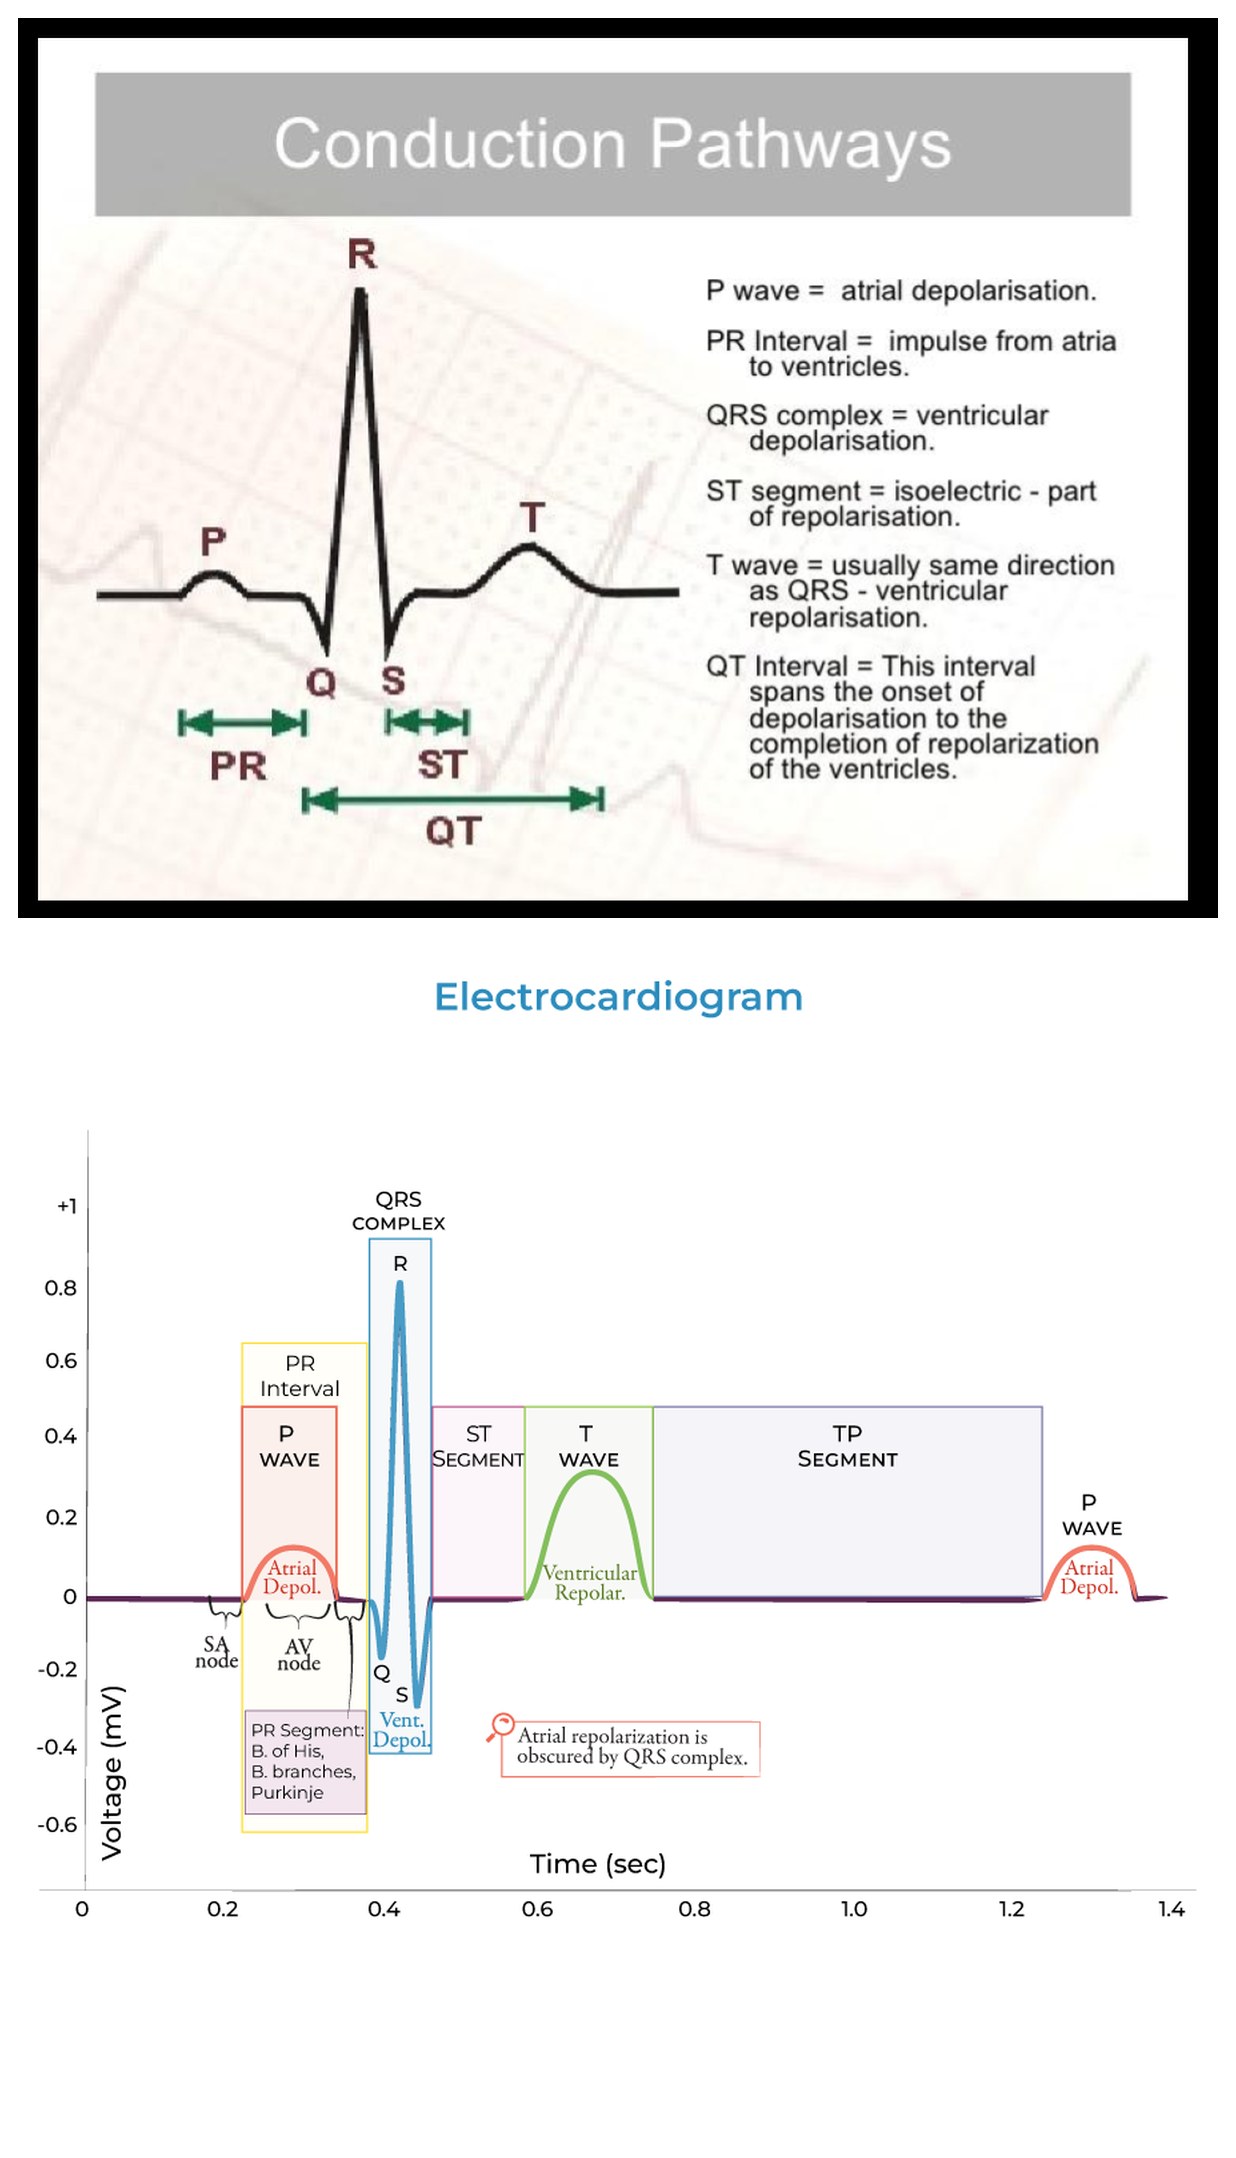
The impulse originates in the sinoatrial (SA) node, high in the right atrium — the heart's dominant pacemaker, firing 60–100 times a minute under normal autonomic tone. From there:
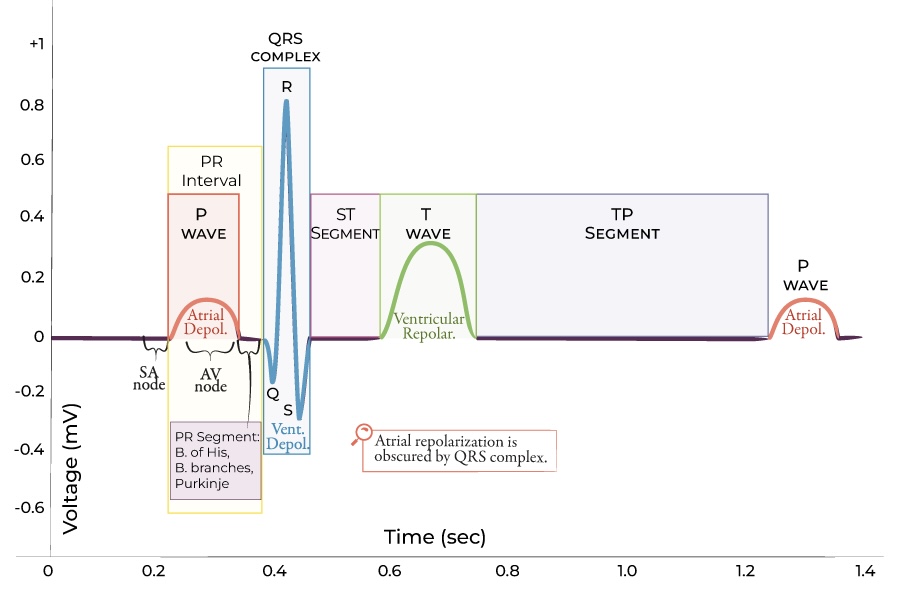
- Depolarisation spreads across both atria, producing the P wave. The right atrium depolarises fractionally before the left.
- The wave reaches the atrioventricular (AV) node, the only normal electrical bridge between atria and ventricles. Here conduction deliberately slows — this "AV delay" is the flat PR segment, and it gives the atria time to empty into the ventricles before they contract.
- Beyond the AV node the impulse accelerates down the bundle of His, splits into the right and left bundle branches, and finally reaches the Purkinje fibres, which spread it almost simultaneously across the ventricular myocardium. This rapid, organised spread is why the normal QRS complex is narrow (< 120 ms).
- Ventricular repolarisation follows, producing the T wave.
The pacemaker hierarchy
Cardiac tissue has a built-in failsafe. If a higher pacemaker fails, a lower one takes over — but each escapes at a slower intrinsic rate:
| Pacemaker | Intrinsic rate | Escape rhythm seen when… |
|---|---|---|
| SA node | 60–100 / min | Normal sinus rhythm |
| Atrial / junctional (AV) tissue | 40–60 / min | SA node fails or is suppressed → junctional escape |
| Ventricular (His–Purkinje) | 20–40 / min | Complete heart block → ventricular escape |
This hierarchy explains a great deal later: why a junctional escape has no visible P wave but a narrow QRS, and why a ventricular escape in complete heart block is slow and broad.
2 · The ECG paper, leads & the 12-lead view
Reading the grid
ECG paper runs at a standard speed of 25 mm/s with a standard gain of 10 mm/mV. On the grid:
- One small square = 1 mm = 0.04 s (40 ms) horizontally, and 0.1 mV vertically.
- One large square (5 small squares) = 0.2 s (200 ms) horizontally, and 0.5 mV vertically.
- Five large squares = 1 second.
Always confirm the calibration marker — the small rectangular step at the start of the trace should be 10 mm tall. If a machine is set to half-standard gain, voltages halve and you may wrongly exclude LVH; at double gain the reverse. Check paper speed too: some rhythm strips run at 50 mm/s, which stretches everything and can masquerade as bradycardia.
The twelve leads and what they see
The 12-lead ECG gives twelve different "camera angles" on the same electrical activity — six in the vertical (frontal) plane from the limb leads, and six in the horizontal plane from the chest leads.
Limb leads (frontal plane): I, II, III, aVR, aVL, aVF. These are derived from just four electrodes on the limbs and view the heart from the sides and inferiorly.
Chest / precordial leads (horizontal plane): V1–V6, marching from the right sternal edge (V1) around to the left mid-axillary line (V6), looking at the heart from front to side.
| Territory | Leads | Usual artery |
|---|---|---|
| Inferior | II, III, aVF | RCA (or dominant circumflex) |
| Septal | V1–V2 | LAD (septal branches) |
| Anterior | V3–V4 | LAD |
| Lateral | I, aVL, V5–V6 | Circumflex / diagonal |
| Posterior (reciprocal in V1–V3) | V7–V9 | Circumflex / RCA |
| Right ventricle | V3R–V4R (esp. V4R) | Proximal RCA |
Learning which leads look at which wall is the single most useful piece of geography in the whole book — it turns "some ST elevation" into "an inferior STEMI, so check the right ventricle and expect reciprocal change in aVL."
3 · A systematic method you will never abandon
The commonest cause of a missed ECG finding is not lack of knowledge — it is reading the ECG in the wrong order, or jumping straight to the obvious abnormality and stopping. Adopt one sequence and apply it to every tracing, well or unwell, for the rest of your career.
The order
- Details & calibration — right patient, date/time, paper speed and gain, and compare with any old ECG.
- Rate — atrial and ventricular; are they the same?
- Rhythm — regular or irregular; is there a P before every QRS and a QRS after every P?
- Axis — normal, left or right.
- P waves — present, shape, and relationship to the QRS.
- PR interval — length and whether it is constant.
- QRS — width, height (voltages), and morphology (Q waves, R-wave progression).
- ST segment — elevation or depression, and in which territory.
- T waves — upright, inverted, peaked or flattened.
- QT interval — corrected for rate.
- Synthesis — pull the findings into a single clinical statement, in context.
The rest of Part I takes steps 2, 3, 6 and 7 of this method in turn, in enough depth that the abnormal chapters later can simply say "the rhythm is…" and you will know exactly how that conclusion was reached.
↑ Contents4 · Rate
Heart rate is the first number you commit to. There are three reliable ways to find it, and you choose by whether the rhythm is regular.
The 300 rule (regular rhythms)
Because five large squares equal one second, 300 large squares pass per minute. Count the number of large squares between two consecutive R waves and divide 300 by it:
| Large squares between R waves | 1 | 2 | 3 | 4 | 5 | 6 |
|---|---|---|---|---|---|---|
| Rate (bpm) | 300 | 150 | 100 | 75 | 60 | 50 |
Memorising the sequence 300 – 150 – 100 – 75 – 60 – 50 lets you eyeball a rate in under a second.
The 6-second (or 10-second) rule (irregular rhythms)
When the rhythm is irregular — atrial fibrillation being the classic example — the R–R distance varies, so the 300 rule fails. Instead count the number of QRS complexes in a 6-second strip (30 large squares) and multiply by 10. Most 12-lead ECGs also print a 10-second rhythm strip; count the complexes across it and multiply by 6.
Defining brady- and tachycardia
- Bradycardia: < 60 bpm. Physiological in athletes and sleep; pathological with syncope, block or drugs.
- Tachycardia: > 100 bpm. The whole of Part IV is, in one sense, a method for classifying the tachycardias.
5 · Rhythm — is it sinus?
Before naming any arrhythmia, decide whether the underlying rhythm is normal sinus rhythm. Four questions settle it.
- Is there a P wave before every QRS?
- Is there a QRS after every P wave?
- Is the P wave upright in II and inverted in aVR? (This confirms the impulse starts high in the right atrium and travels downward — i.e. from the SA node.)
- Is the PR interval constant and normal (120–200 ms)?
If all four are yes and the rate is 60–100, the rhythm is normal sinus rhythm. Deviations point the way: a P that is not upright in II suggests a non-sinus atrial focus or lead misplacement; a varying PR suggests AV block or a wandering pacemaker; absent P waves suggest AF, a junctional rhythm or fine flutter.
Regularity
March a piece of paper or callipers across three or four R–R intervals. Regular rhythms have constant R–R; regularly irregular rhythms have a repeating pattern (e.g. grouped beating in Wenckebach); irregularly irregular rhythms have no pattern at all (AF is the archetype). This one observation splits the tachycardias and bradycardias into manageable groups, as Part IV will show.
6 · The cardiac axis
The axis is the net direction of ventricular depolarisation in the frontal plane. It sounds abstract but is quickly estimated and genuinely useful — axis shifts are a clue to hypertrophy, conduction block, infarction and pulmonary disease.
The quick method — leads I and aVF
Look at the net QRS deflection (whether it is predominantly up or down) in lead I and lead aVF:
| Lead I | Lead aVF | Axis |
|---|---|---|
| Positive ↑ | Positive ↑ | Normal (−30° to +90°) |
| Positive ↑ | Negative ↓ | Left axis deviation (check lead II) |
| Negative ↓ | Positive ↑ | Right axis deviation |
| Negative ↓ | Negative ↓ | Extreme axis ("northwest") |
Refine left axis with lead II: if the QRS in II is also net negative, left axis deviation is confirmed (beyond −30°). The "two thumbs" aide-mémoire: if I and aVF both point up (like two thumbs up), the axis is normal; "leaving each other" (I up, aVF down) is left; "reaching towards each other" (I down, aVF up) is right.
Causes to recognise
| Left axis deviation | Right axis deviation |
|---|---|
| Left anterior fascicular block | Right ventricular hypertrophy |
| Inferior MI | Left posterior fascicular block |
| LVH (sometimes) | Lateral MI |
| Some congenital defects; WPW | PE / cor pulmonale, COPD; WPW |
7 · Waves, intervals & segments in detail
With rate, rhythm and axis established, examine each component of the complex. The normal ranges below are the reference points every later chapter measures against.
The P wave
Small (< 2.5 mm tall, < 120 ms wide), upright in II and inverted in aVR. Best seen in II and V1. A tall peaked P suggests right atrial enlargement (P pulmonale); a broad notched P suggests left atrial enlargement (P mitrale) — both are covered in Chapter 8.
The PR interval
Measured from the start of P to the start of QRS; normal 120–200 ms (3–5 small squares). Long PR = first-degree AV block or AV nodal disease. Short PR with a delta wave = pre-excitation (WPW). A PR segment that is depressed points to pericarditis.
The QRS complex
- Width: normal < 120 ms (3 small squares). A broad QRS means the ventricles were not depolarised via the normal His–Purkinje system — bundle branch block, ventricular rhythm, pre-excitation, or hyperkalaemia.
- Nomenclature: a Q wave is any initial negative deflection; R is the first positive deflection; S is a negative deflection after an R.
- R-wave progression: across V1→V6 the R wave should grow and the S wave shrink, with the "transition" (R = S) around V3–V4. Poor R-wave progression suggests old anterior MI, LVH or lead placement error.
- Pathological Q waves: > 40 ms wide or > 25% of the following R-wave height — a marker of established (often old) infarction.
The ST segment
Normally isoelectric (level with the baseline drawn between the end of one T and the next P). Elevation and depression are the heart of Part III; the amount, shape and territory all matter.
The T wave
Normally upright in most leads (inverted in aVR, variable in V1 and III). Tall peaked T waves suggest hyperkalaemia or hyperacute ischaemia; deep symmetrical inversion suggests ischaemia (see Wellens, Chapter 16); flattening and U waves suggest hypokalaemia.
The QT interval
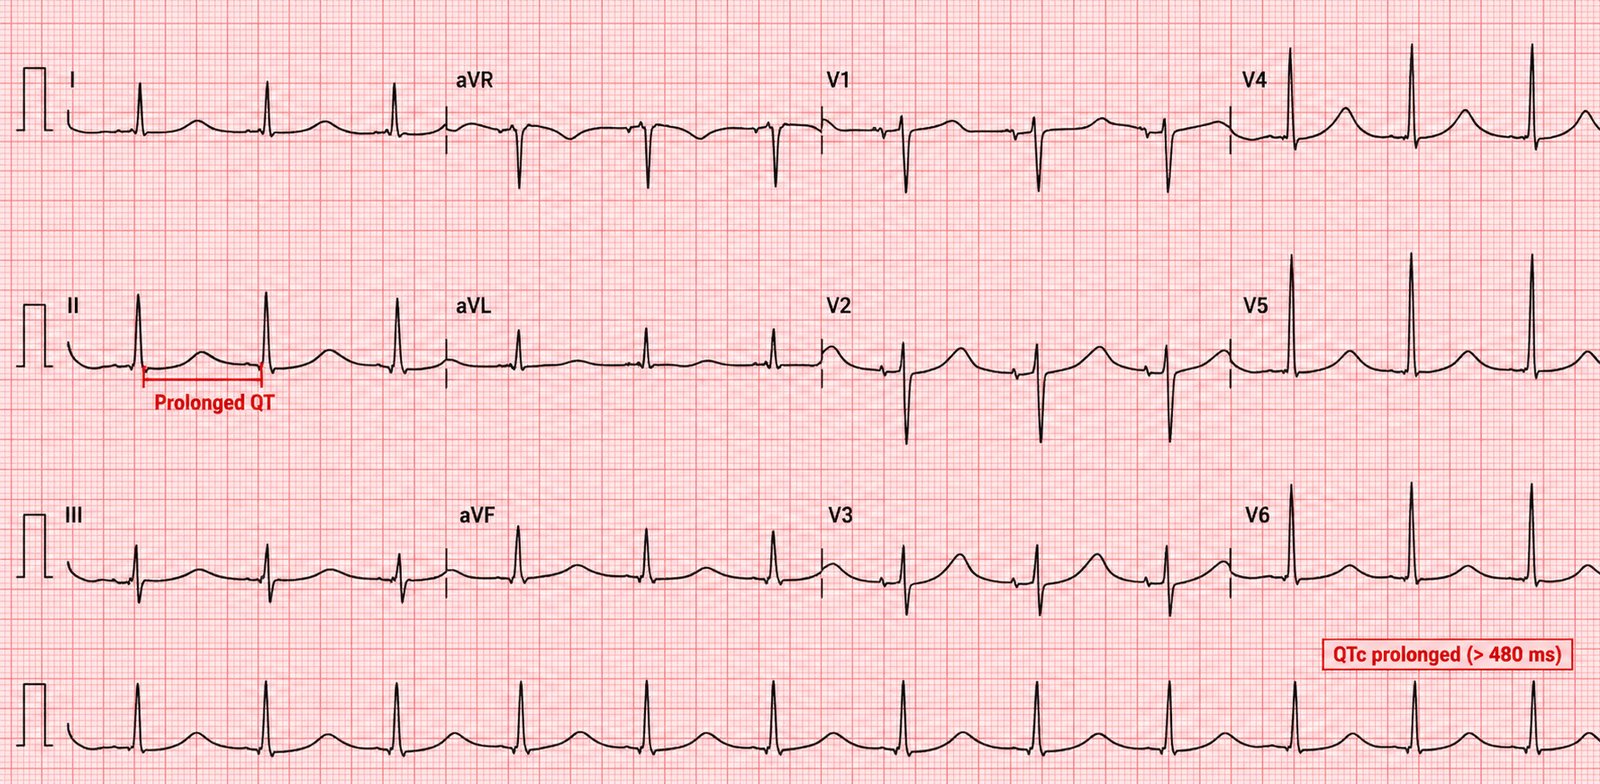
From the start of QRS to the end of T. Because it shortens as heart rate rises, it must be corrected for rate (QTc). A useful bedside check: the QT should be less than half the preceding R–R interval at normal rates. A prolonged QTc predisposes to torsades de pointes (Chapters 25 and 27).
| Component | Normal value | If abnormal, think… |
|---|---|---|
| P wave | < 2.5 mm, < 120 ms | Atrial enlargement |
| PR interval | 120–200 ms | AV block / pre-excitation |
| QRS width | < 120 ms | BBB, ventricular origin, hyperK |
| QTc | < ~440 ms (M) / 460 ms (F) | Torsades risk / channelopathy |
Part II · Chambers & conduction
Structural change alters the electrical signal in predictable ways. Enlarged chambers generate bigger voltages and shift the axis; damaged conduction tissue widens and re-shapes the QRS. This part teaches you to read the anatomy of the heart from the shape of its complexes.
8 · Atrial abnormalities (P-wave analysis)
The P wave is small and easily ignored, yet it tells you about atrial size and pressure. Analyse it in lead II (for width and height) and lead V1 (which shows right and left atrial components separately, because V1 sits over the atria).
Right atrial enlargement — "P pulmonale"
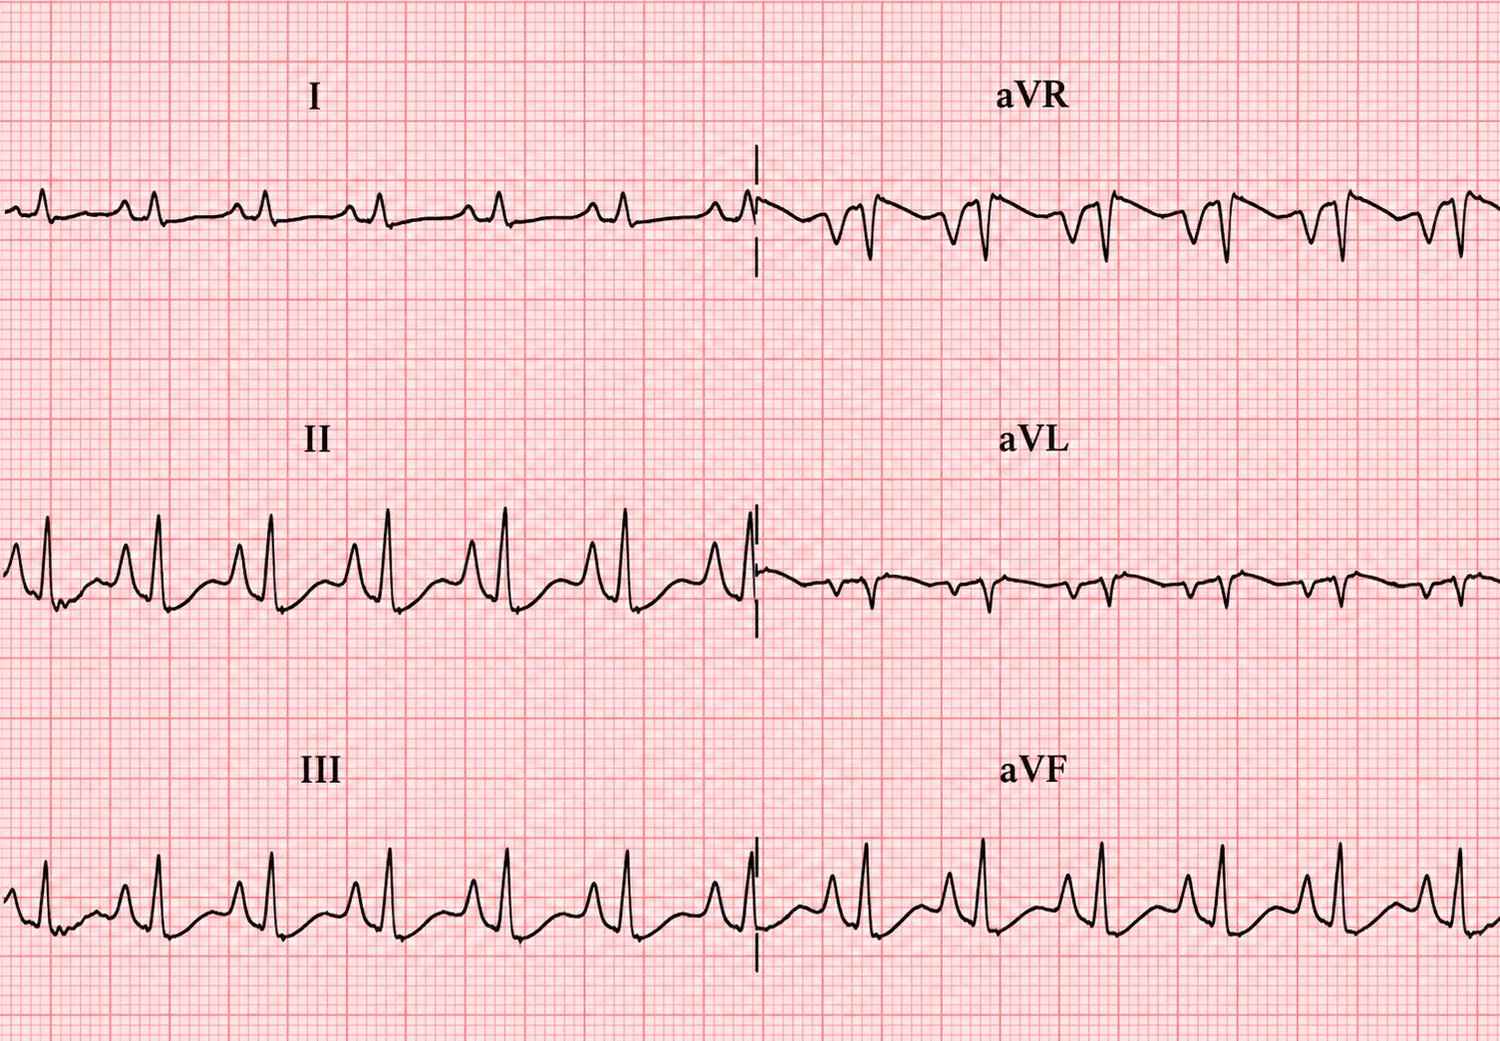
The right atrium depolarises first, so it dominates the early part of the P wave. When it is enlarged the P becomes tall and peaked (> 2.5 mm in lead II) with a large initial positive deflection in V1. Causes: chronic lung disease and cor pulmonale, pulmonary hypertension, tricuspid disease, and — acutely — pulmonary embolism.
Left atrial enlargement — "P mitrale"
The left atrium depolarises later, so it dominates the terminal P. Enlargement makes the P broad and notched (> 120 ms, "M-shaped" in II) with a deep, wide terminal negative component in V1. Causes: mitral valve disease (classically mitral stenosis), hypertension and any cause of raised left atrial pressure.
9 · Ventricular hypertrophy — LVH, RVH & HCM
Left ventricular hypertrophy
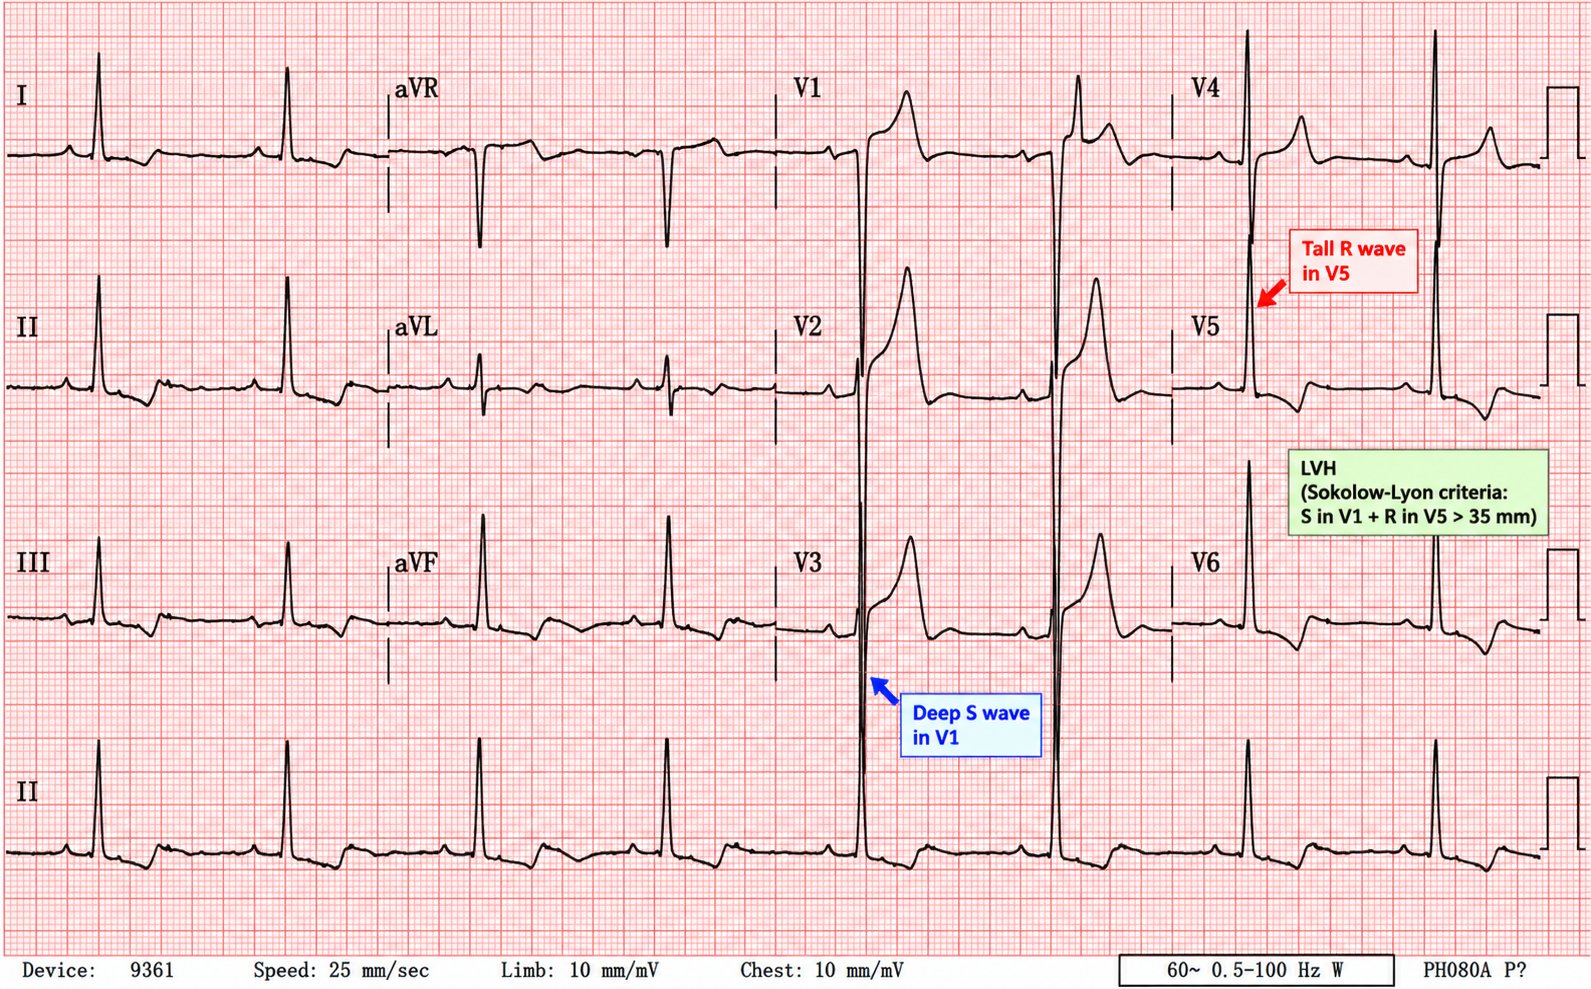
A thicker left ventricle generates larger leftward voltages, so the R waves in the left-sided leads grow and the S waves in the right-sided leads deepen. The most used voltage criteria:
- Sokolow–Lyon: S in V1 + R in V5 or V6 > 35 mm.
- Cornell: R in aVL + S in V3 > 28 mm (men) / 20 mm (women).
- R in aVL > 11 mm alone is suggestive.
With established LVH you often also see a strain pattern — downsloping ST depression and asymmetric T-wave inversion in the lateral leads (I, aVL, V5–V6). This matters because LVH with strain is a classic STEMI mimic and a cause of "poor R-wave progression."
Right ventricular hypertrophy
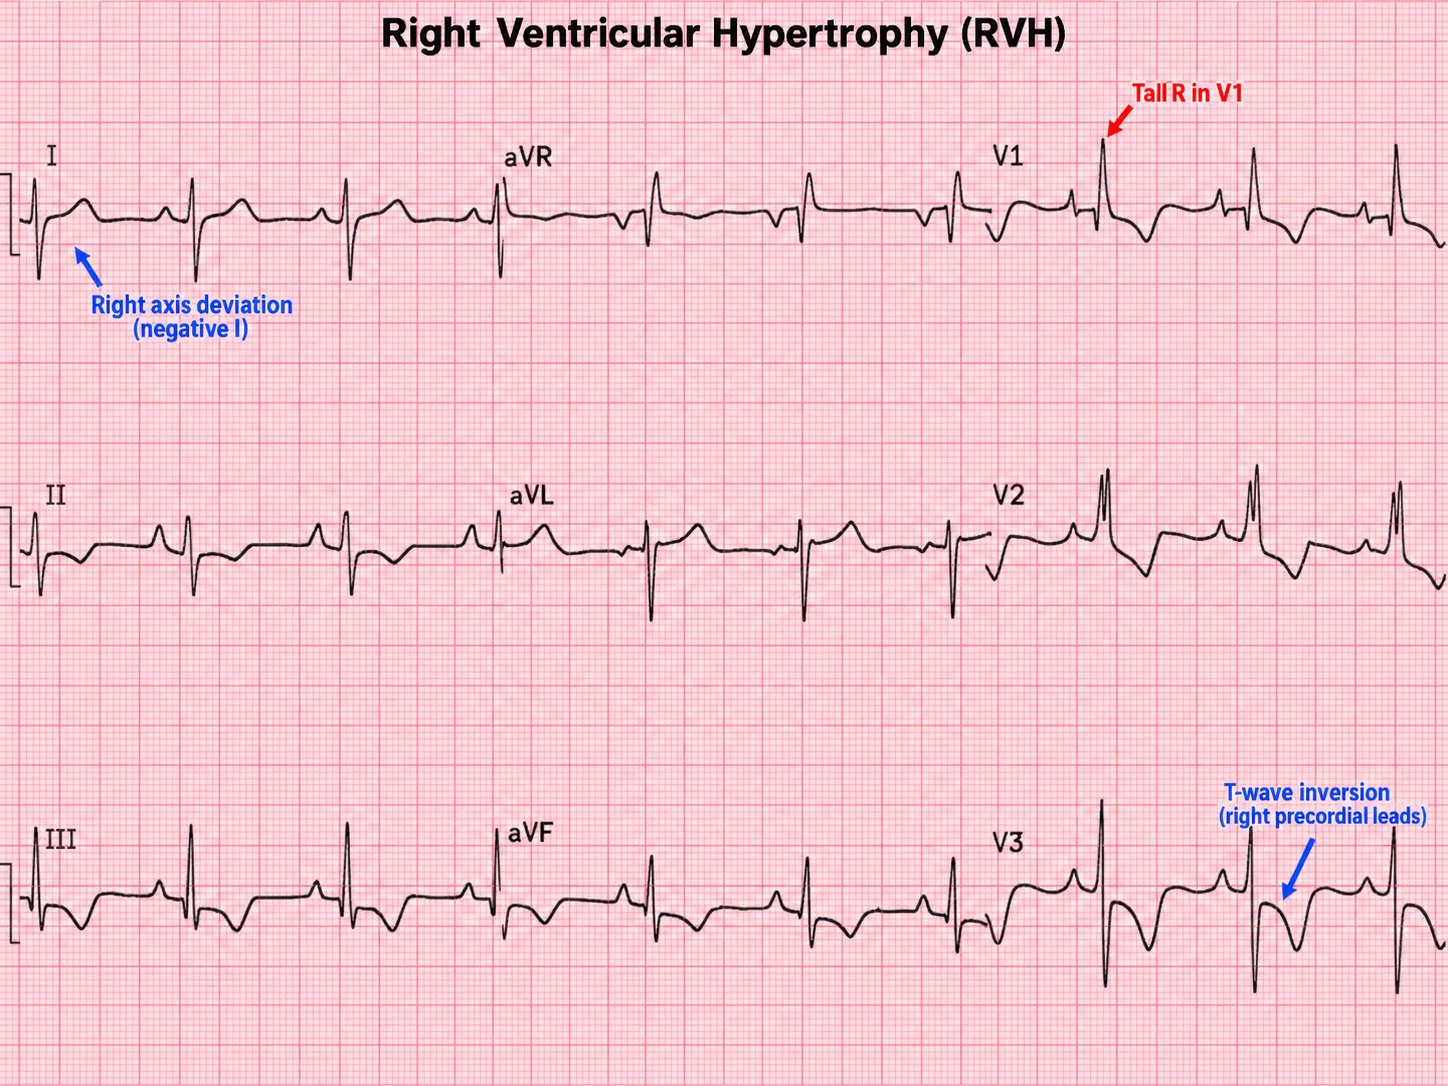
RVH pushes the axis rightward and produces a dominant R wave in V1 (R > S in V1), often with right axis deviation, a deep S in V6, and a right-sided strain pattern (T inversion V1–V3). Causes mirror those of right atrial enlargement: pulmonary hypertension, chronic lung disease, congenital heart disease and PE.
Hypertrophic cardiomyopathy
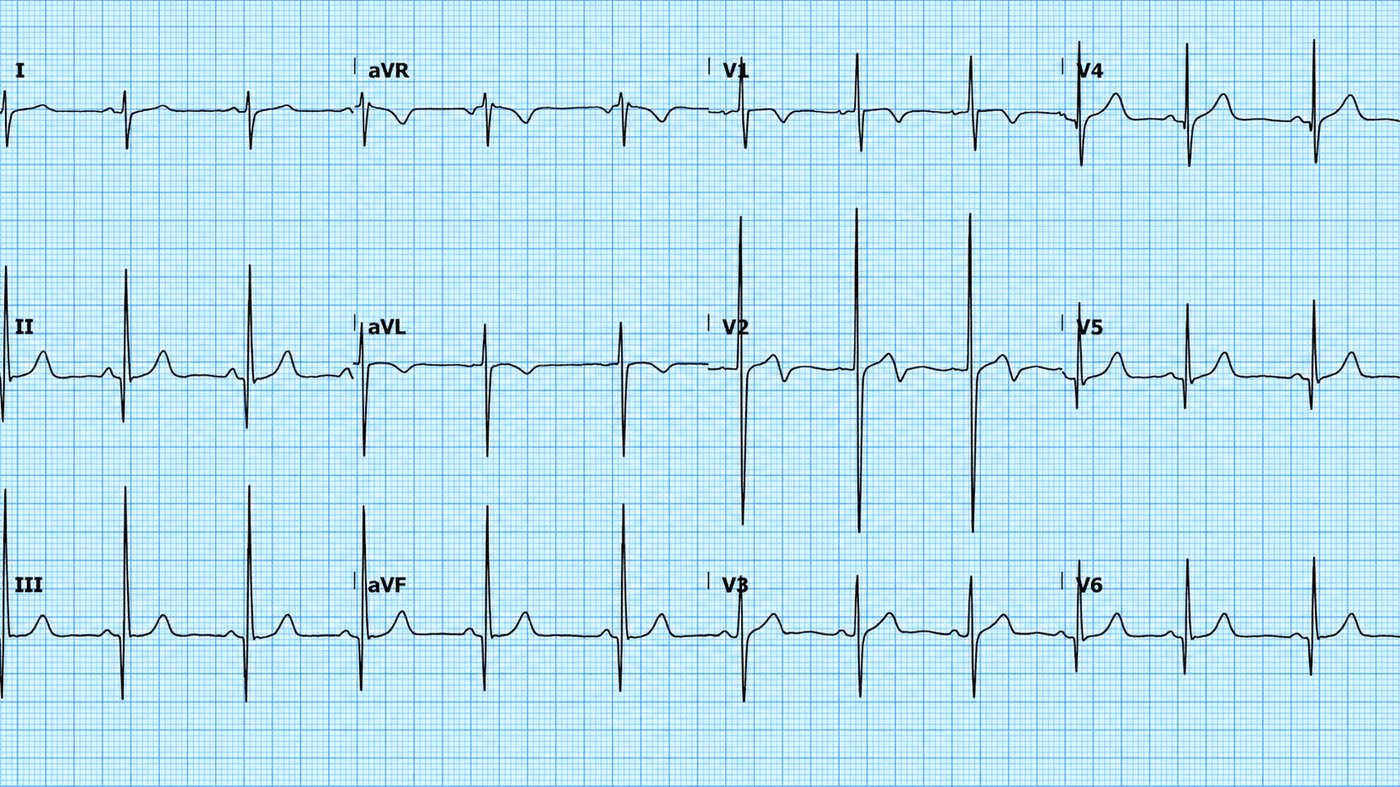
HCM produces very high LVH voltages, deep narrow "dagger" Q waves (from septal hypertrophy) in the lateral/inferior leads, and widespread T-wave changes — sometimes giant T-wave inversions in the apical variant. In a young patient with syncope or a family history of sudden death, these findings are a red flag.
10 · Bundle branch block — RBBB & LBBB
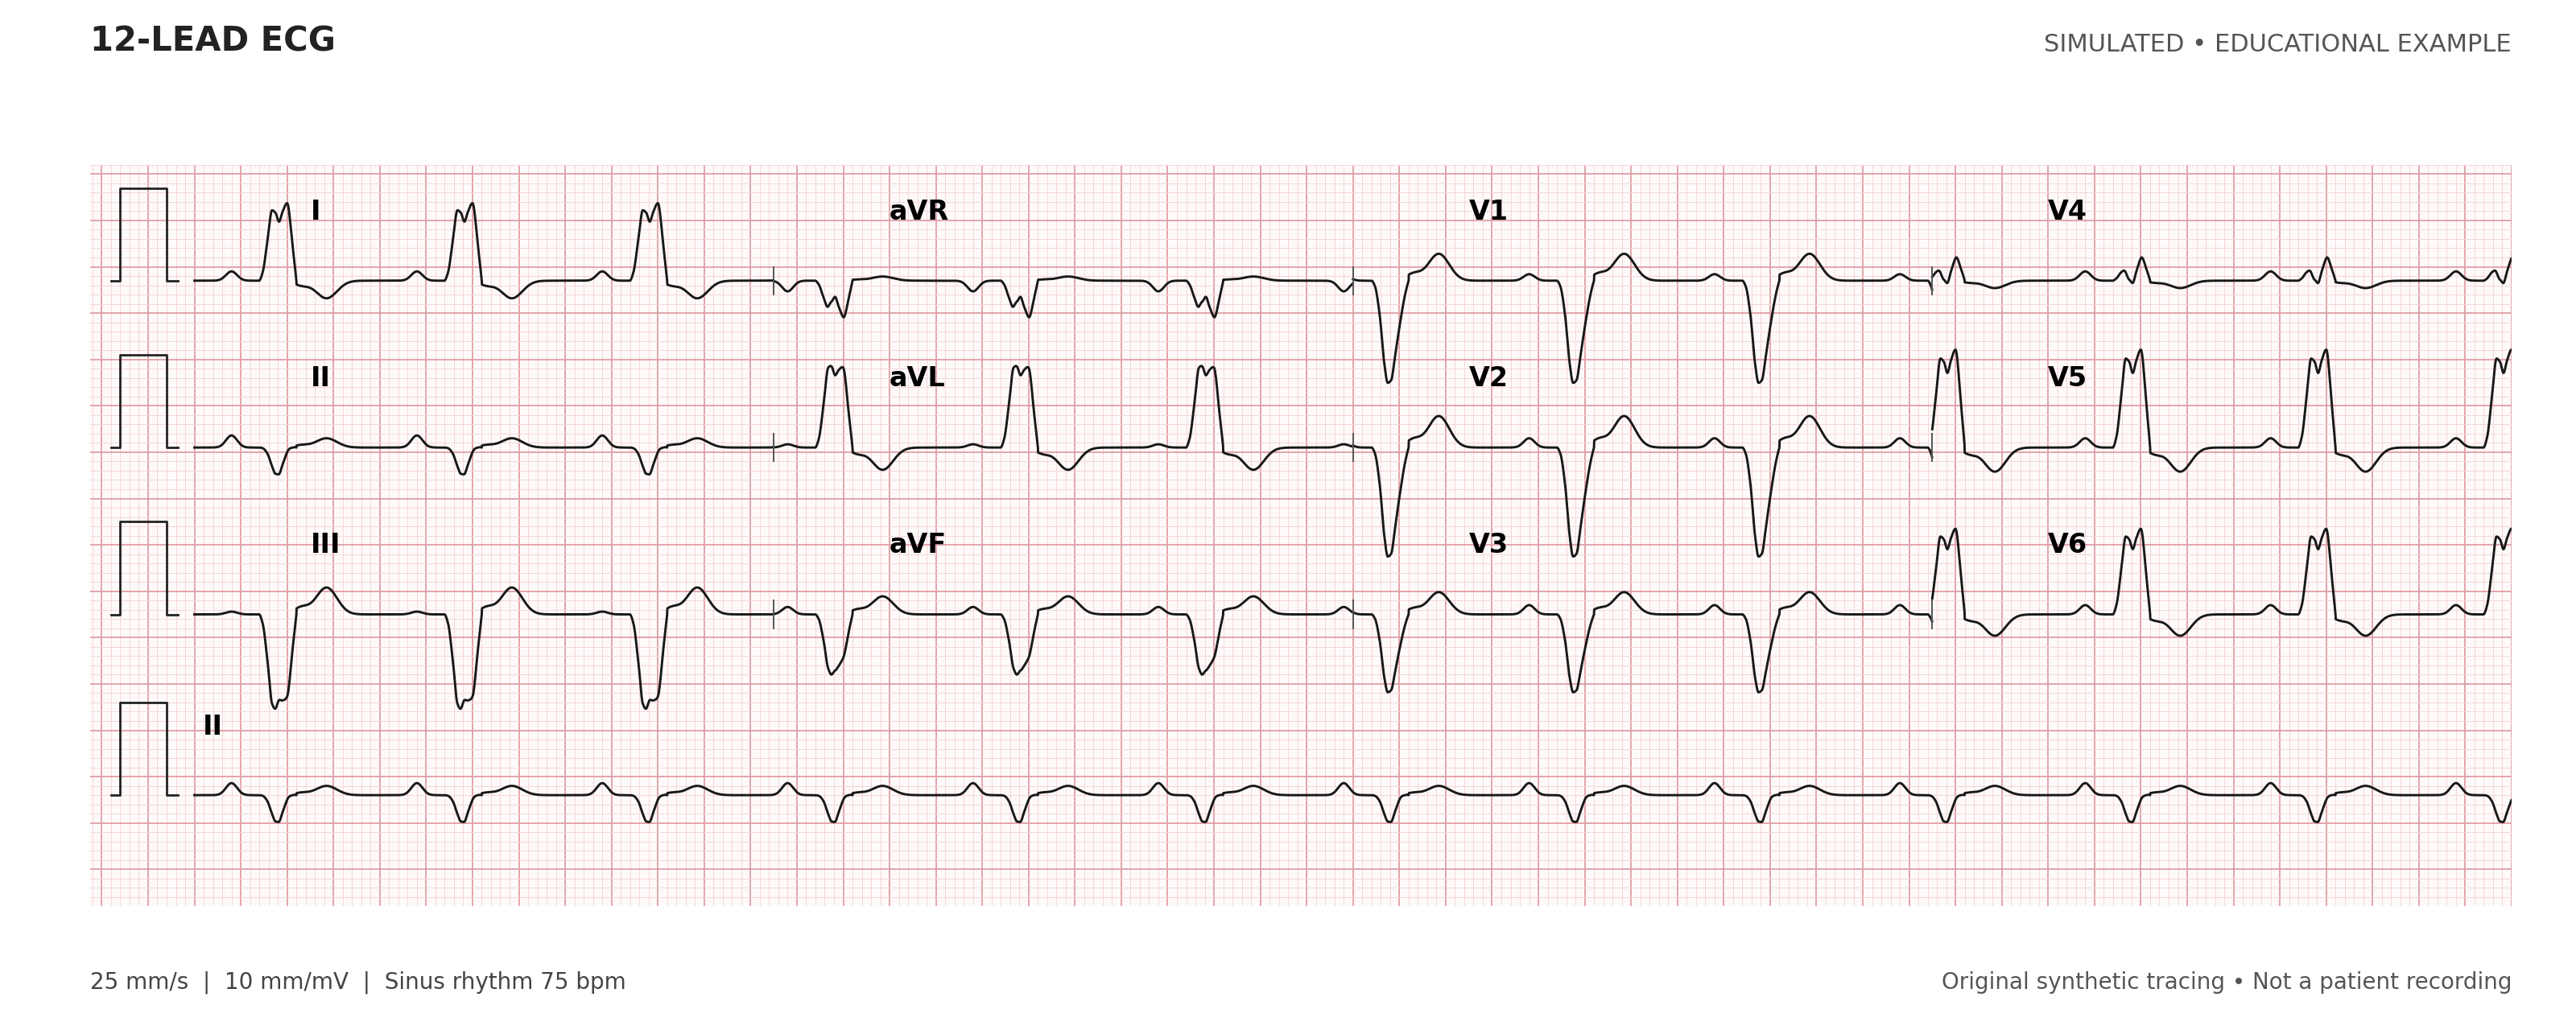
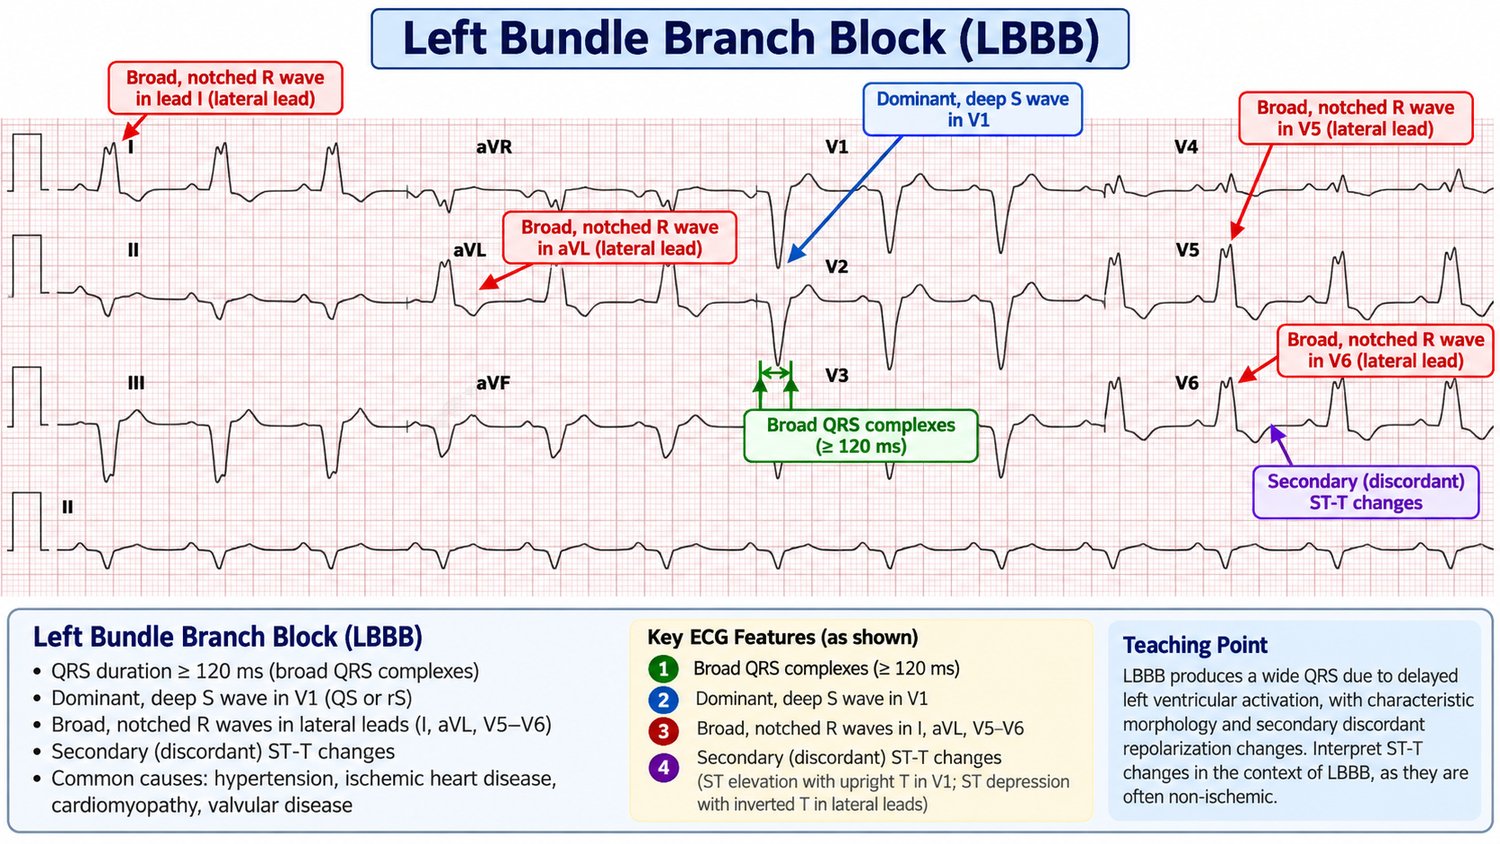
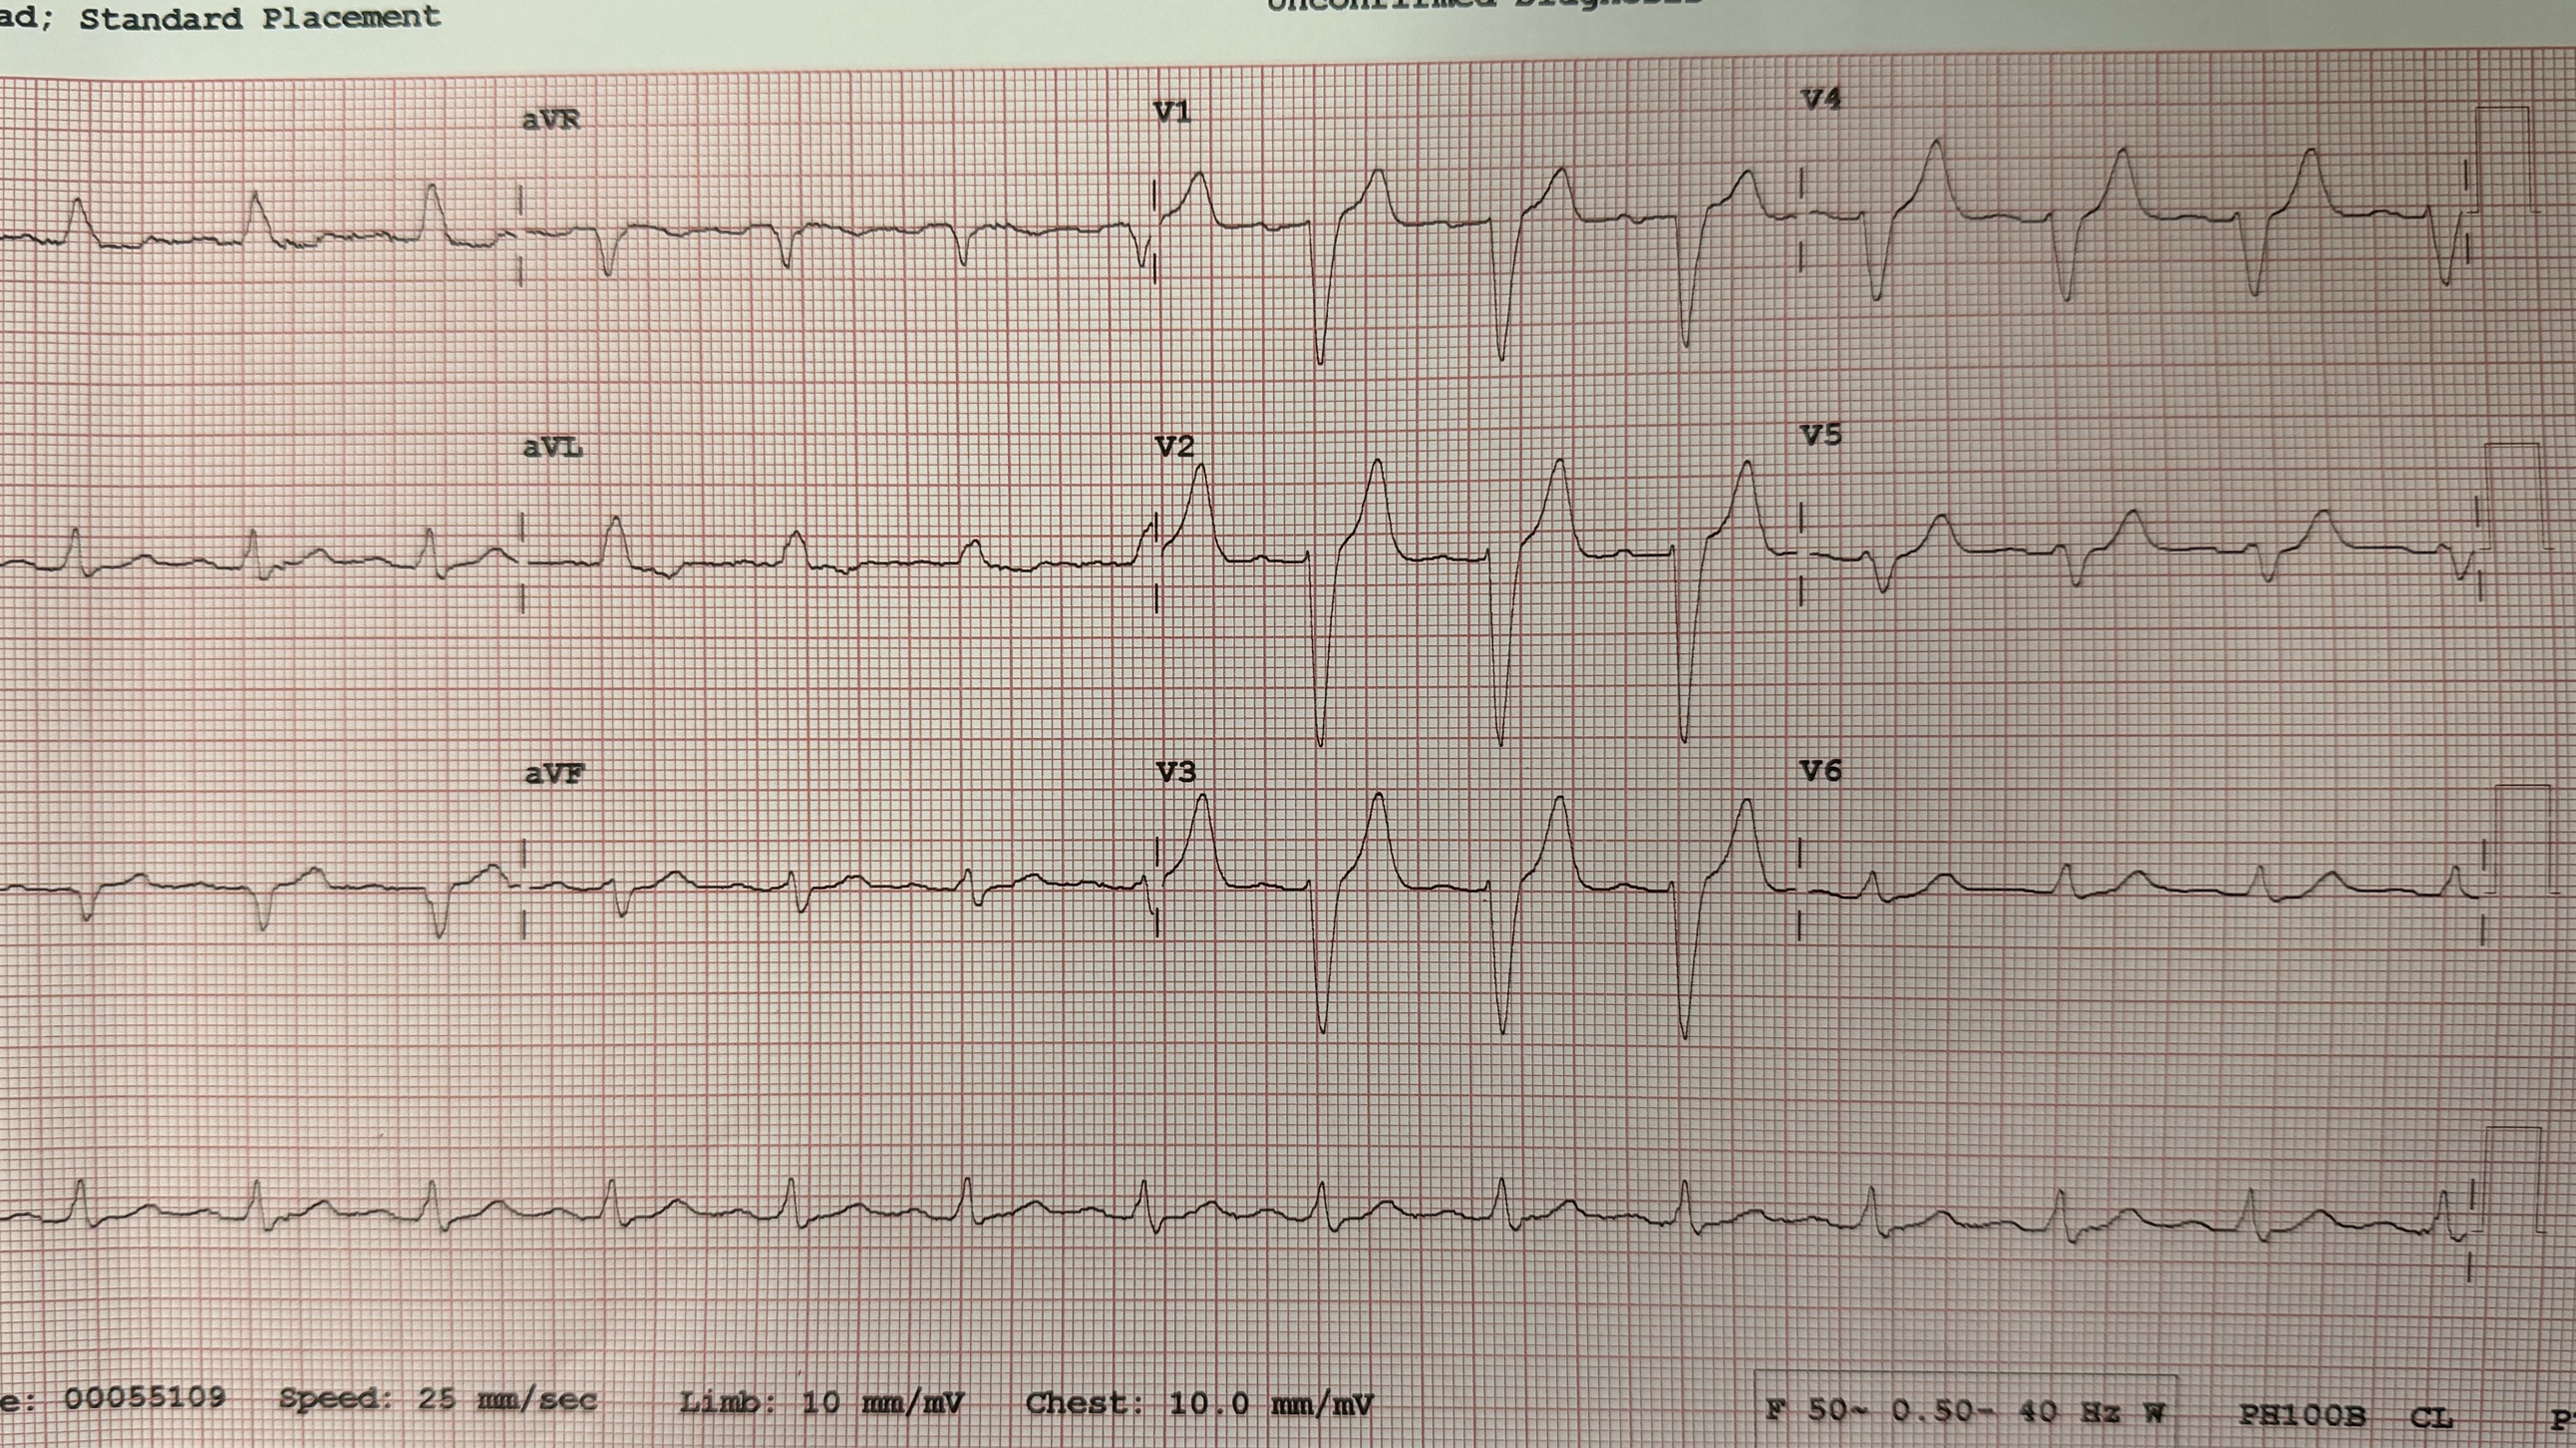
If one bundle branch is blocked, that ventricle is depolarised late and slowly, cell-to-cell, rather than via the fast Purkinje system. The result is a broad QRS (≥ 120 ms) with a characteristic shape. Two questions identify the block: is the QRS broad? and what does V1 look like?
Right bundle branch block (RBBB)
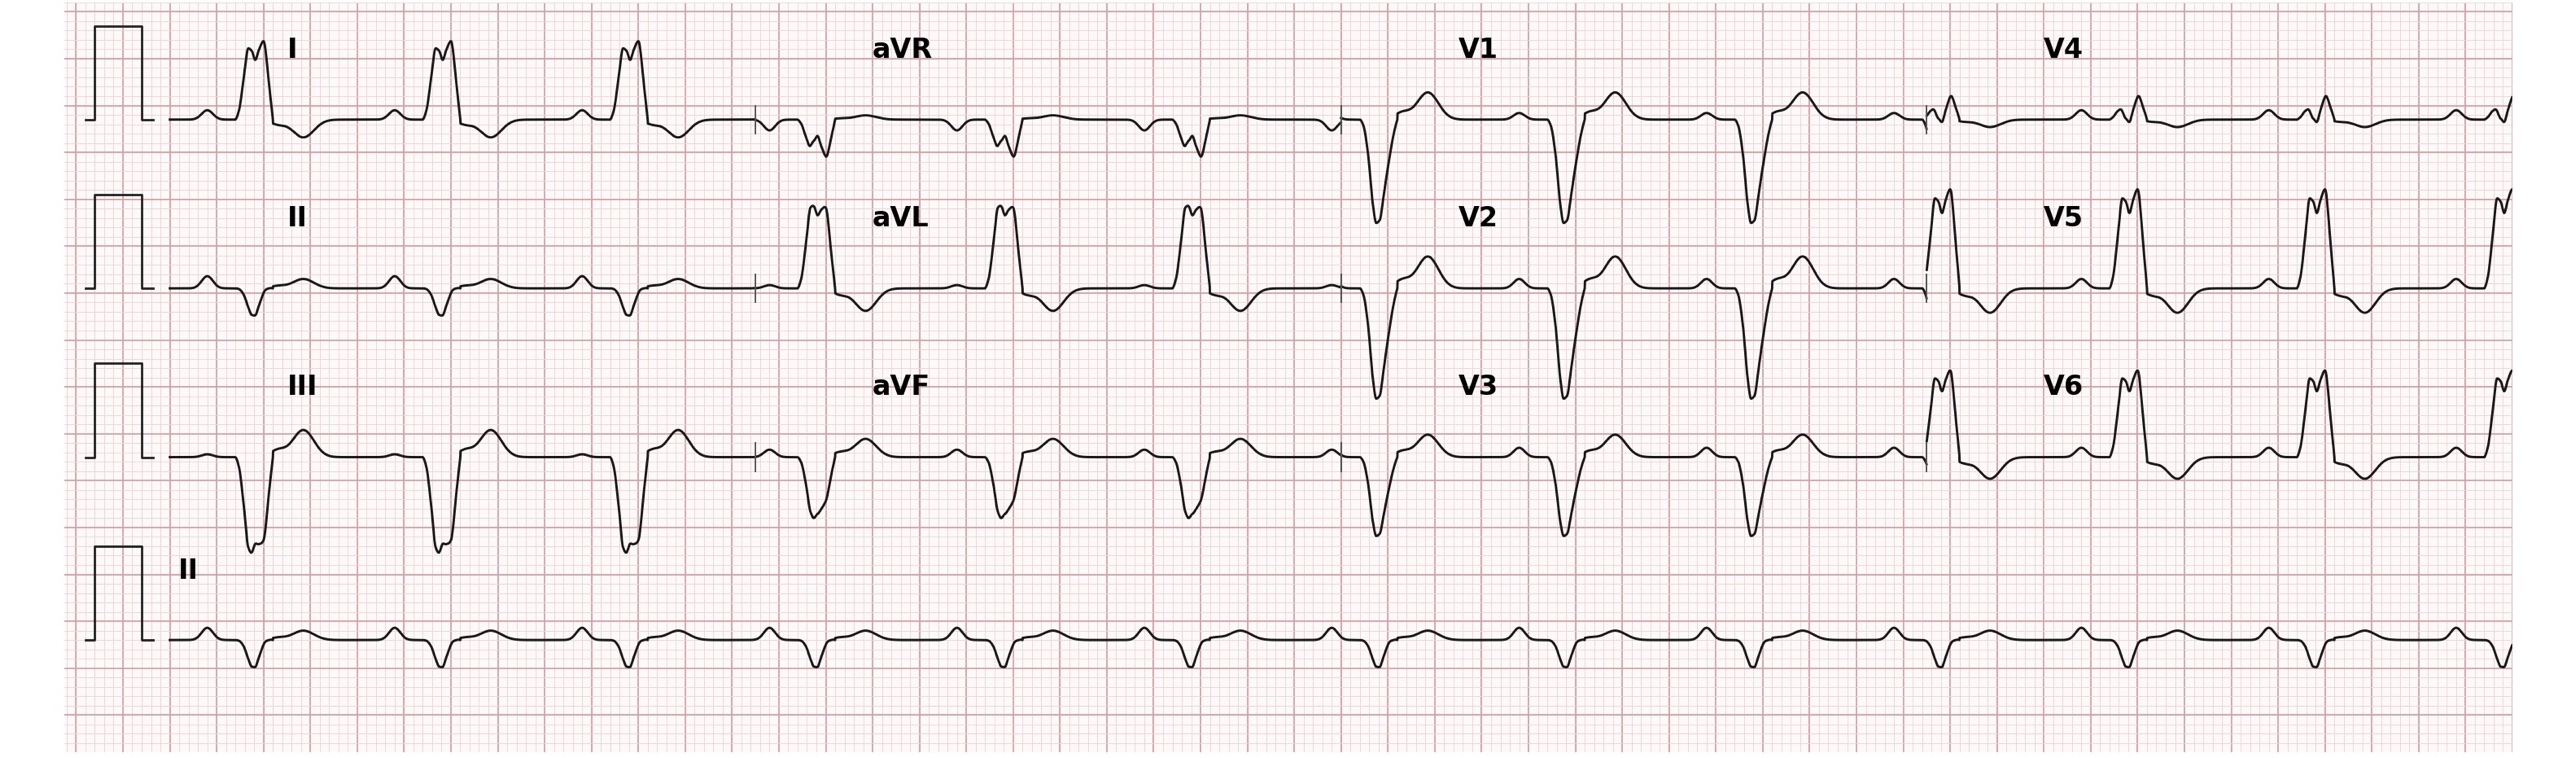
The right ventricle depolarises late, producing a second R wave in the right-sided leads. The signature is an rSR′ ("M-shaped") complex in V1 and a broad slurred S wave in the lateral leads (I, V6) — the classic "MaRRoW" (M in V1, W in V6).
Left bundle branch block (LBBB)
The left ventricle depolarises late, giving a broad monophasic R wave in the lateral leads (I, aVL, V6) and a deep QS or rS in V1 — the classic "WiLLiaM" (W in V1, M in V6). Because LBBB reverses the normal septal depolarisation, it produces secondary ST/T changes (discordant to the QRS) that obscure the ST segment.
11 · Fascicular & multifascicular block
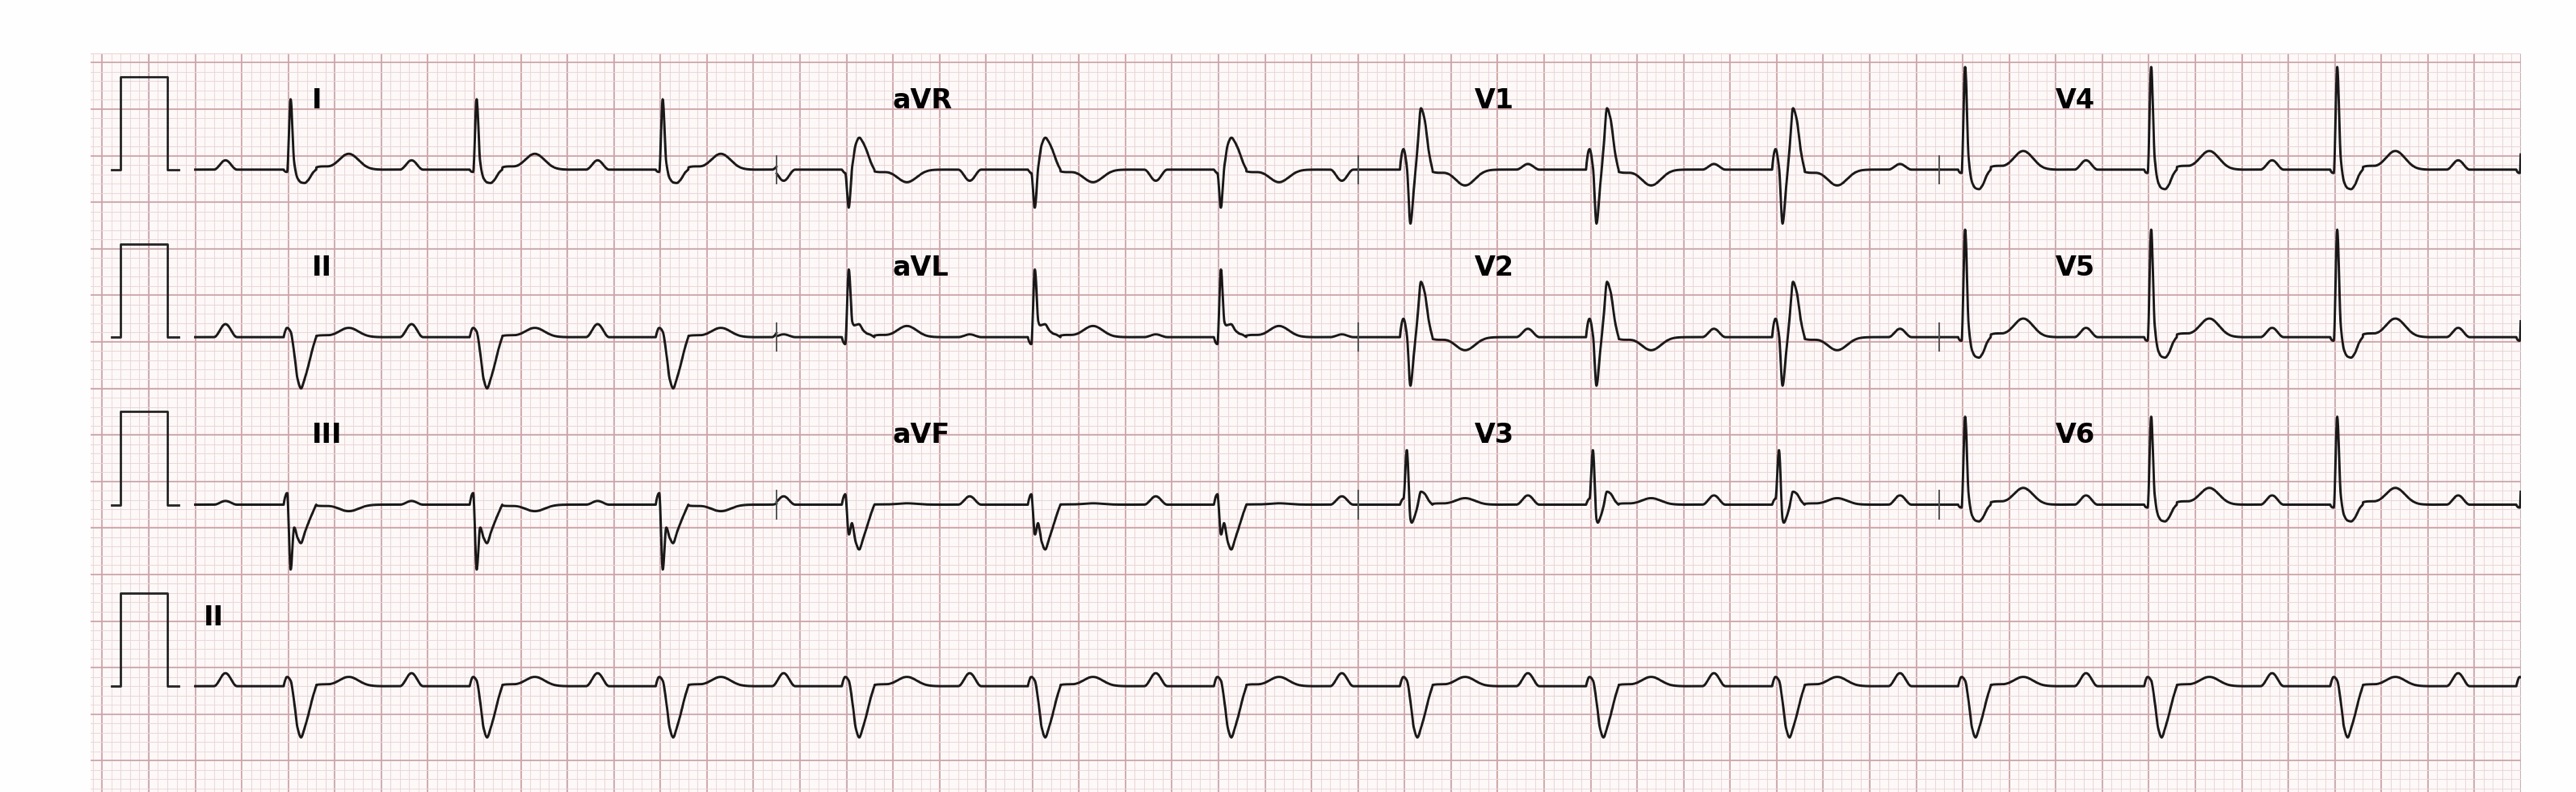
The left bundle divides into an anterior and a posterior fascicle. Blocking one fascicle does not widen the QRS much, but it swings the axis.
- Left anterior fascicular block (LAFB): left axis deviation (beyond −45°), small q in I/aVL and small r in II/III/aVF, with only mild QRS widening. The commonest cause of marked left axis deviation.
- Left posterior fascicular block (LPFB): right axis deviation with the reverse pattern; rarer, and you must exclude other causes of right axis (RVH, lateral MI, PE) first.
Bifascicular & trifascicular block
Bifascicular block = RBBB + one fascicular block (usually RBBB + LAFB). Trifascicular block describes bifascicular block plus a long PR interval (first-degree AV block), implying disease in all three conduction pathways. It signals that the patient is one step from complete heart block.
12 · AV block — first, second & third degree
AV block describes delayed or failed conduction between atria and ventricles. Grade it by studying the relationship between P waves and QRS complexes across a rhythm strip.
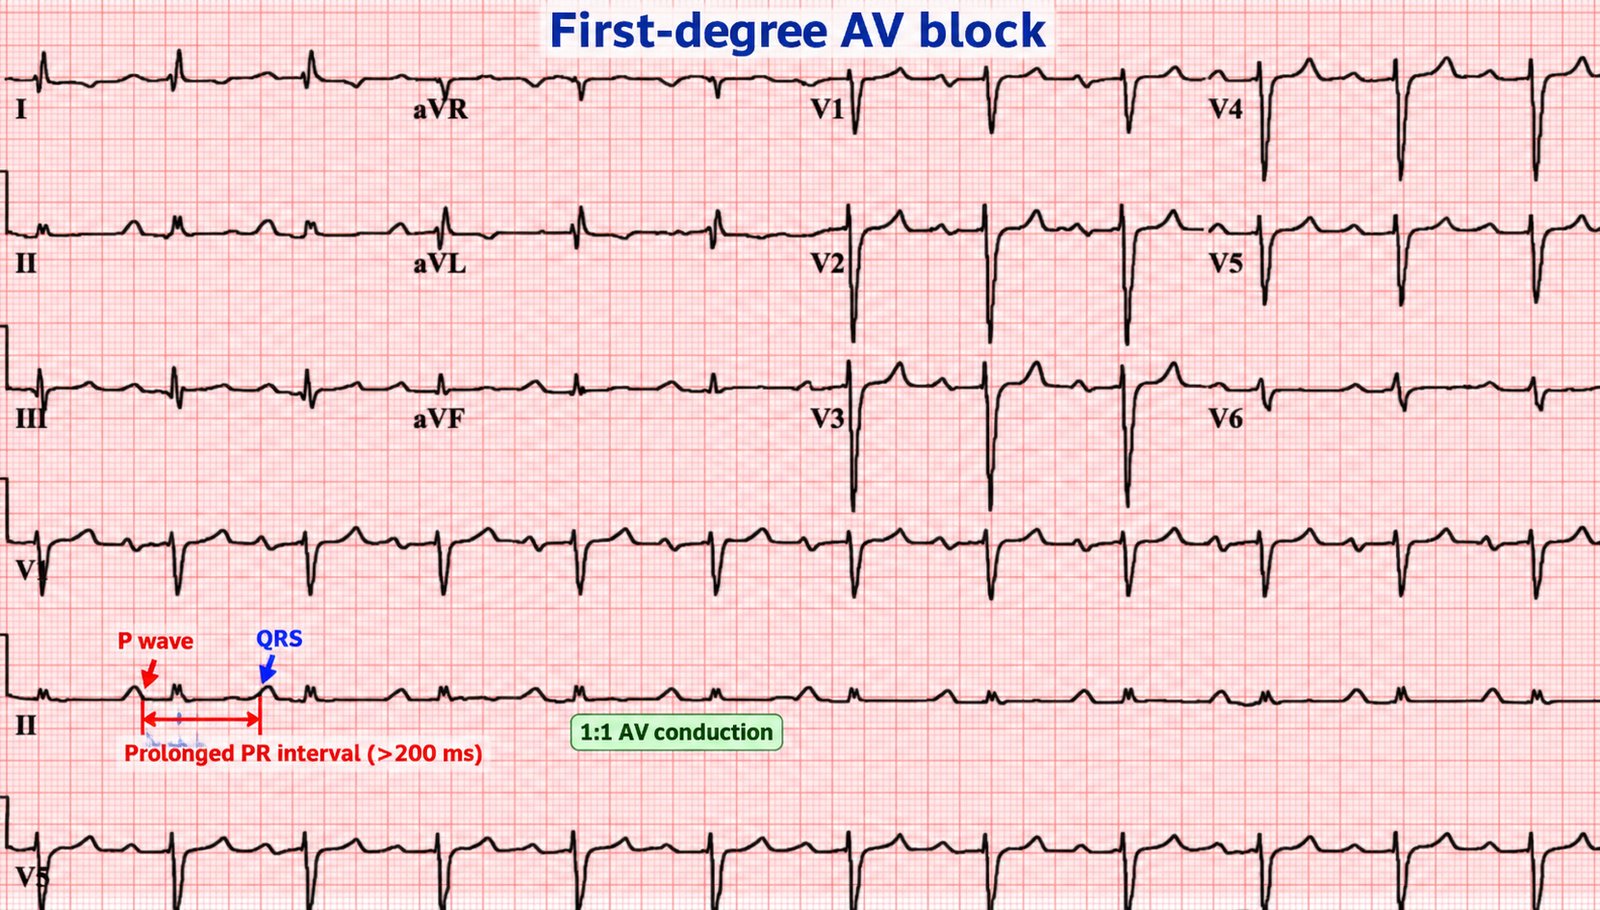
First-degree AV block
Every P conducts, but slowly: a fixed, prolonged PR interval > 200 ms. Usually benign and often needs no action.
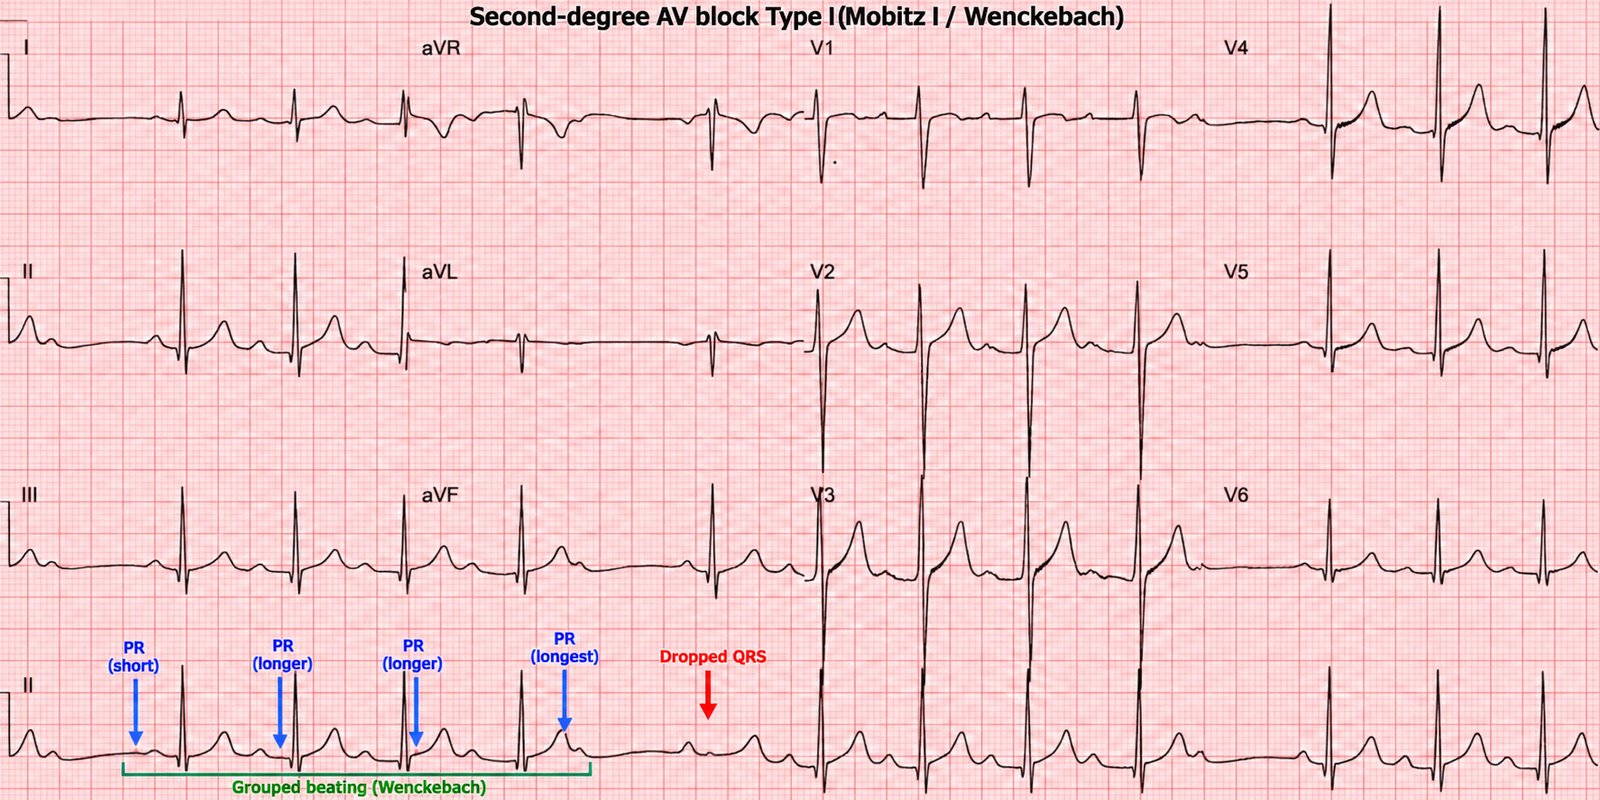
Second-degree AV block — Mobitz I (Wenckebach)
The PR interval lengthens progressively until a P wave fails to conduct and a QRS is dropped, then the cycle resets. It produces "grouped beating" and is usually benign (AV nodal level, vagal or drug-related).
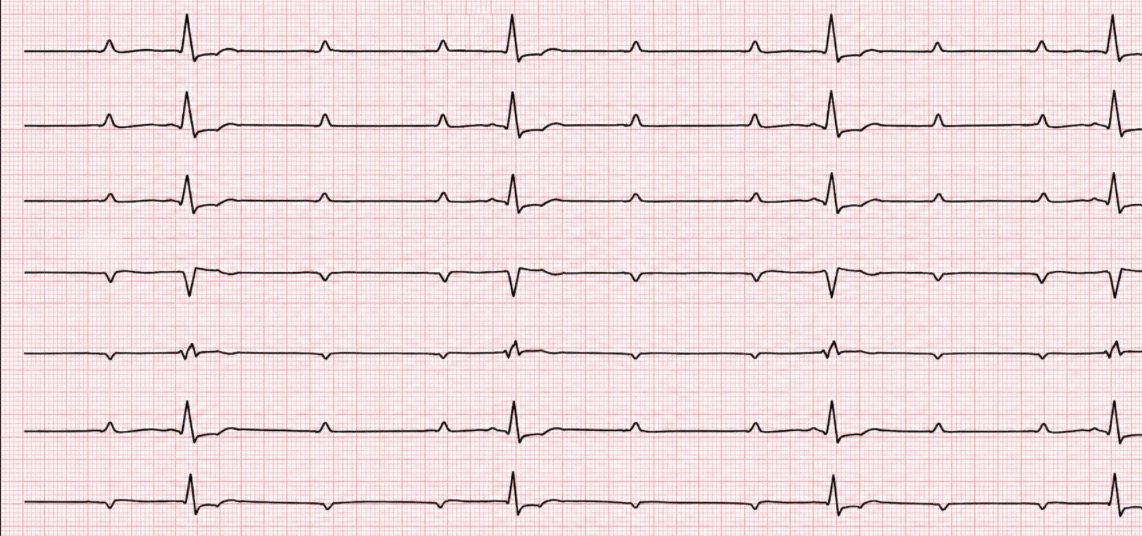
Second-degree AV block — Mobitz II
The PR interval is constant, then a P wave suddenly fails to conduct without warning. This reflects disease below the AV node (His–Purkinje) and is dangerous — it progresses unpredictably to complete heart block. A 2:1 block (every other P conducts) can be either type; grouped beating and a narrow QRS favour Mobitz I, a broad QRS favours Mobitz II.
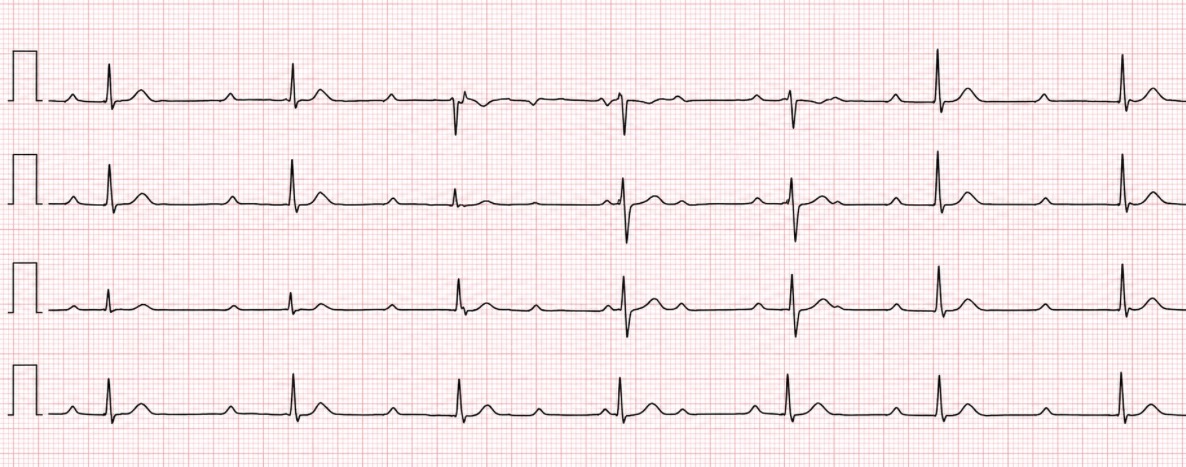
Third-degree (complete) heart block
No P waves conduct at all. The atria and ventricles beat independently — AV dissociation — with the ventricles kept going by an escape pacemaker. Look for P waves marching through at their own rate, QRS complexes at a slower rate, and no relationship between them. A narrow escape (40–60) suggests a junctional origin; a broad, slow escape (20–40) suggests a ventricular origin and is more unstable.
Part III · Ischaemia & infarction
This is the part that saves lives. Acute coronary occlusion is a time-critical diagnosis made largely on the ECG. The goal is not to memorise a threshold but to recognise the pattern and territory of ischaemia — and to know the traps that hide a genuine occlusion behind a "non-diagnostic" tracing.
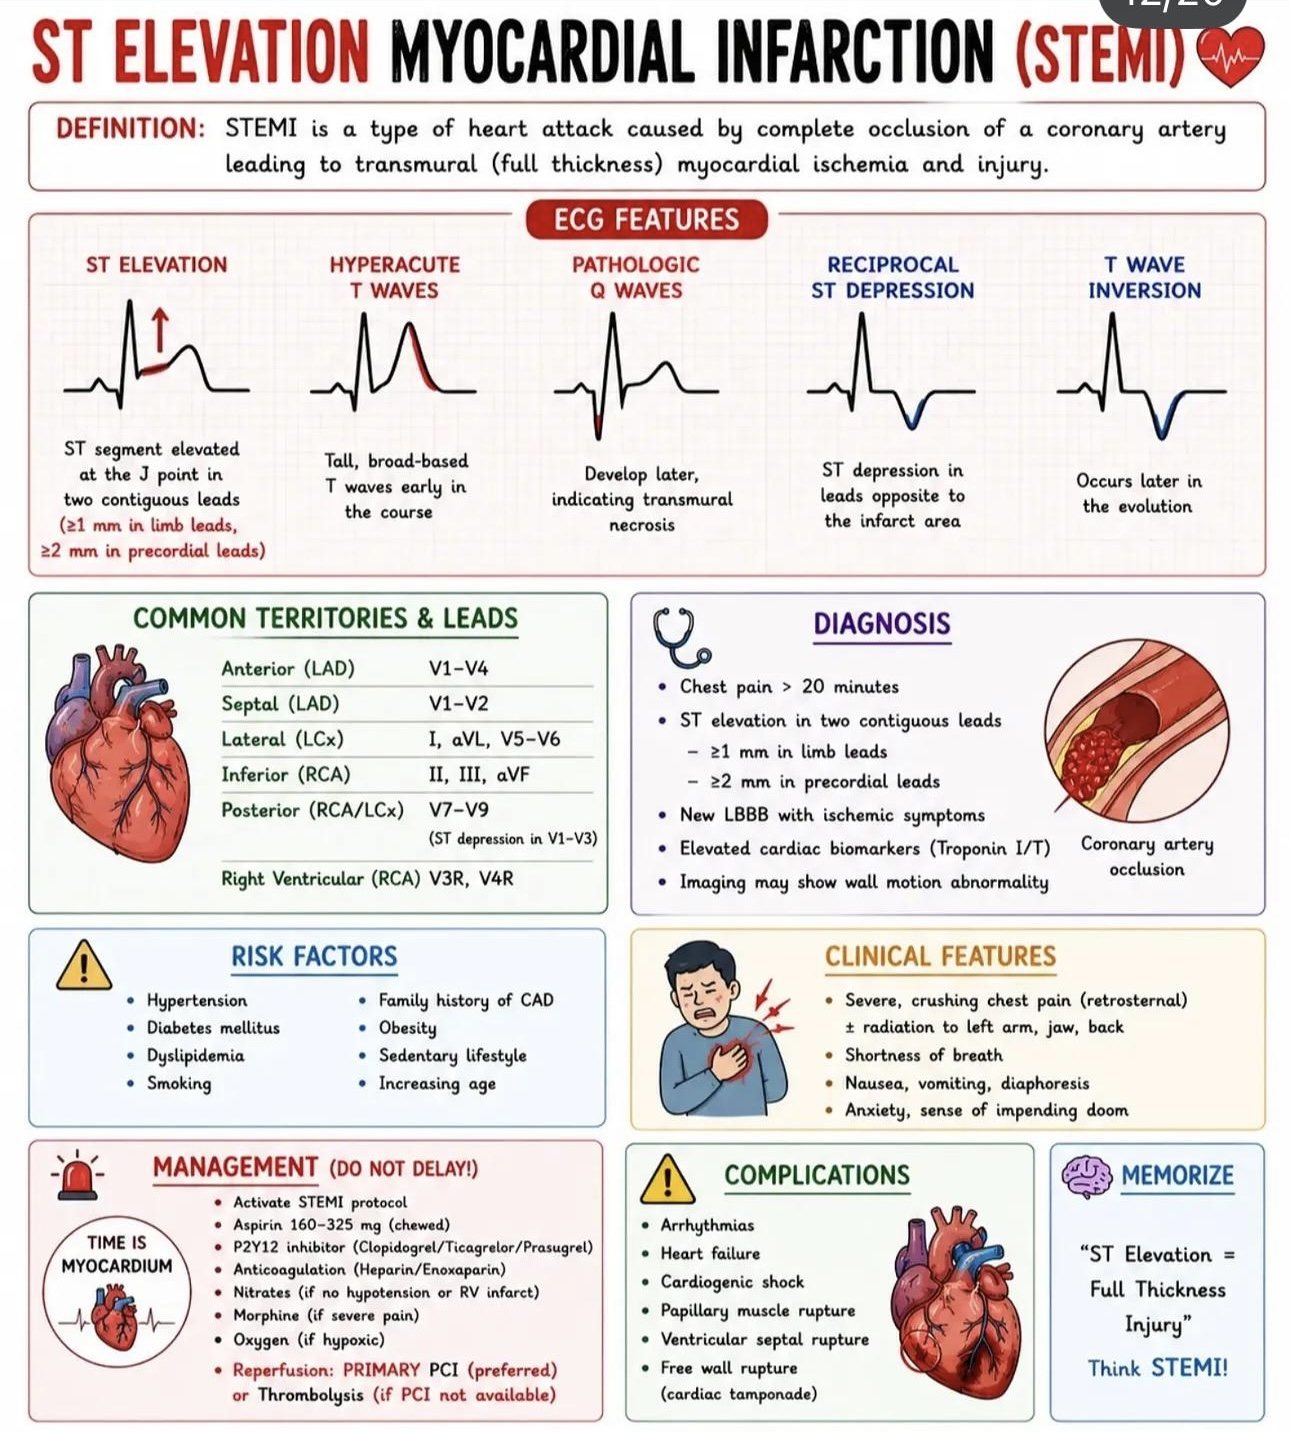
13 · The language of ischaemia — ST, T & Q
Coronary occlusion evolves through a recognisable sequence, and each stage has its own ECG signature. Reading the ST segment, T wave and Q wave together tells you not just whether there is infarction but roughly when it happened.
The evolution of an infarct
- Hyperacute T waves — the earliest change: tall, broad, symmetrical T waves, minutes after occlusion.
- ST elevation — the injury current of transmural ischaemia; convex ("tombstone") or straightened.
- Q-wave formation — hours later, as myocardium dies and becomes electrically silent.
- T-wave inversion — as the infarct evolves over hours to days.
- ST normalisation — with a residual Q wave marking the old scar.
ST elevation — what counts
Measured at the J point (where the QRS meets the ST segment), relative to the baseline. Conventional thresholds for a "STEMI":
- ≥ 1 mm in two contiguous limb leads, or
- ≥ 2 mm in two contiguous chest leads (≥ 2.5 mm in men < 40; ≥ 1.5 mm in women for V2–V3).
But thresholds are a floor, not a rule. Shape matters more than height: convex-upward or straightened ST elevation with reciprocal change is ischaemic; concave ("smiley") elevation is more often benign — though never rely on shape alone.
ST depression & T-wave inversion
ST depression may be a reciprocal change (mirroring elevation elsewhere — always look for the primary injury), the marker of subendocardial ischaemia (NSTEMI), or a sign of posterior STEMI when it sits in V1–V3. T-wave inversion is non-specific but, when deep and symmetrical in a coronary territory, signals ischaemia — the Wellens pattern being the important example.
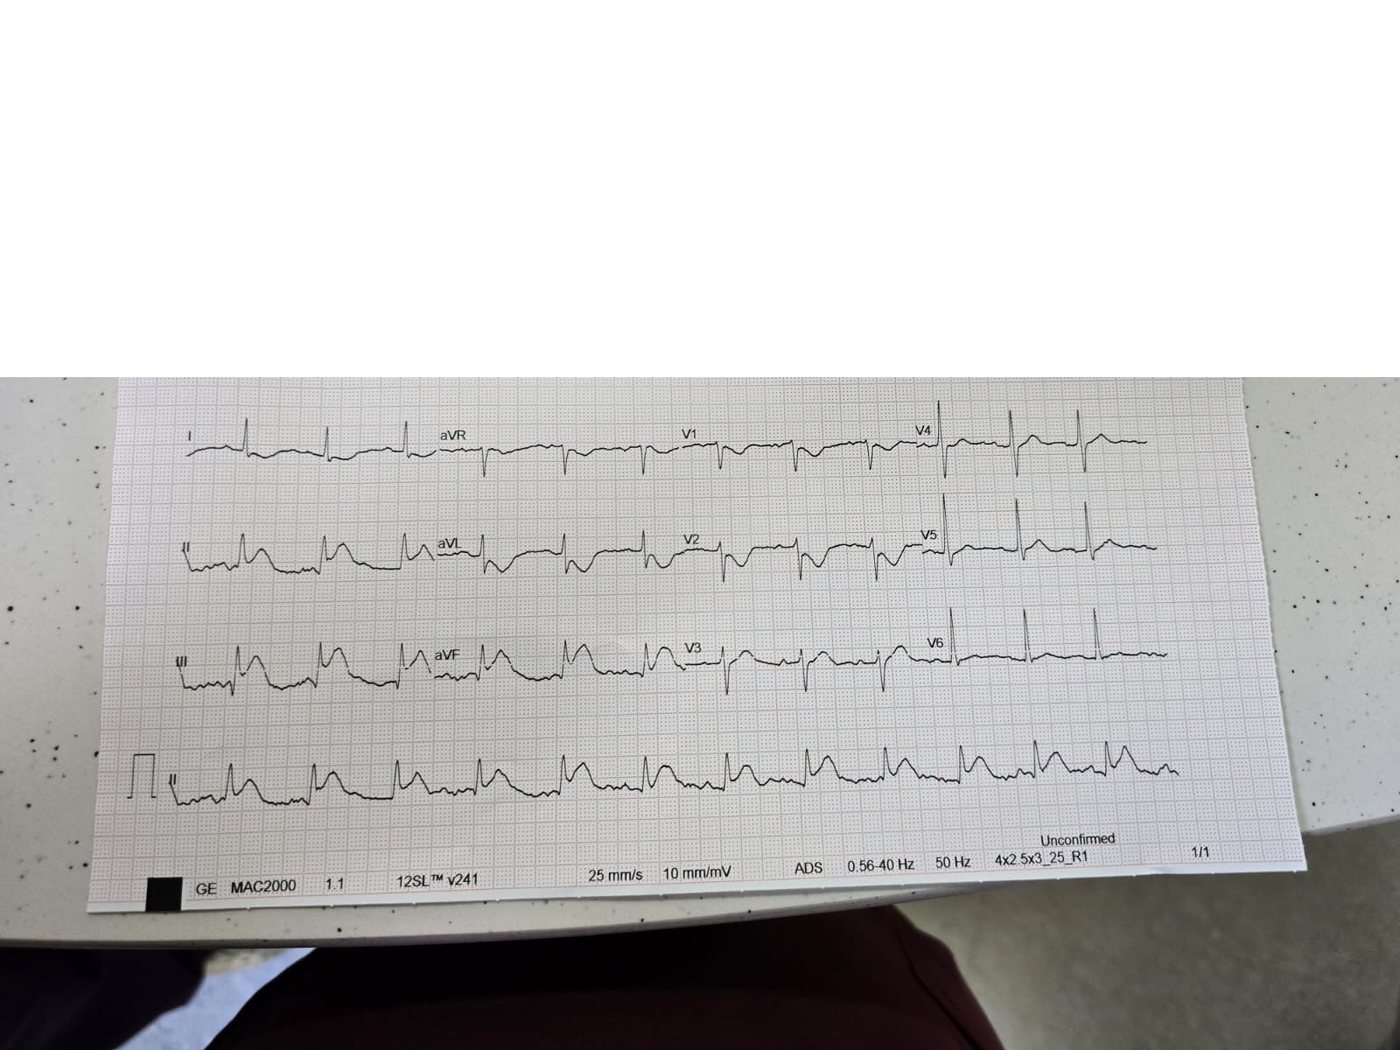
14 · STEMI & the culprit artery
Because each coronary artery supplies a defined territory, the pattern of ST elevation localises the occlusion. This lets you predict the culprit vessel, anticipate complications, and communicate precisely with the cath lab.
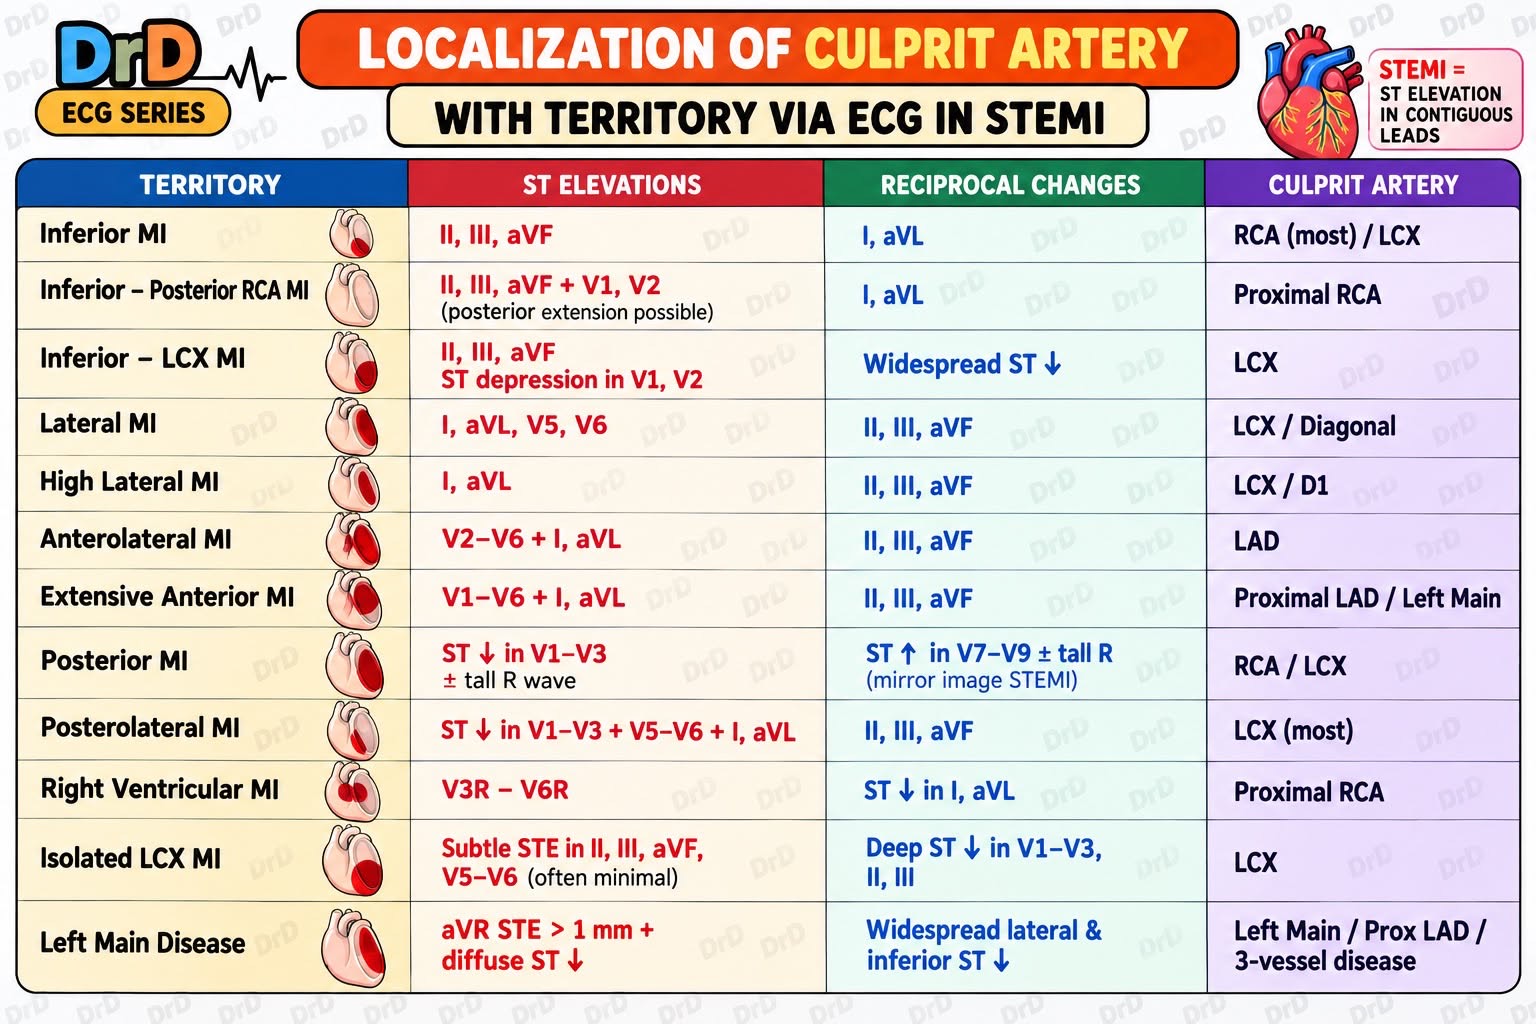
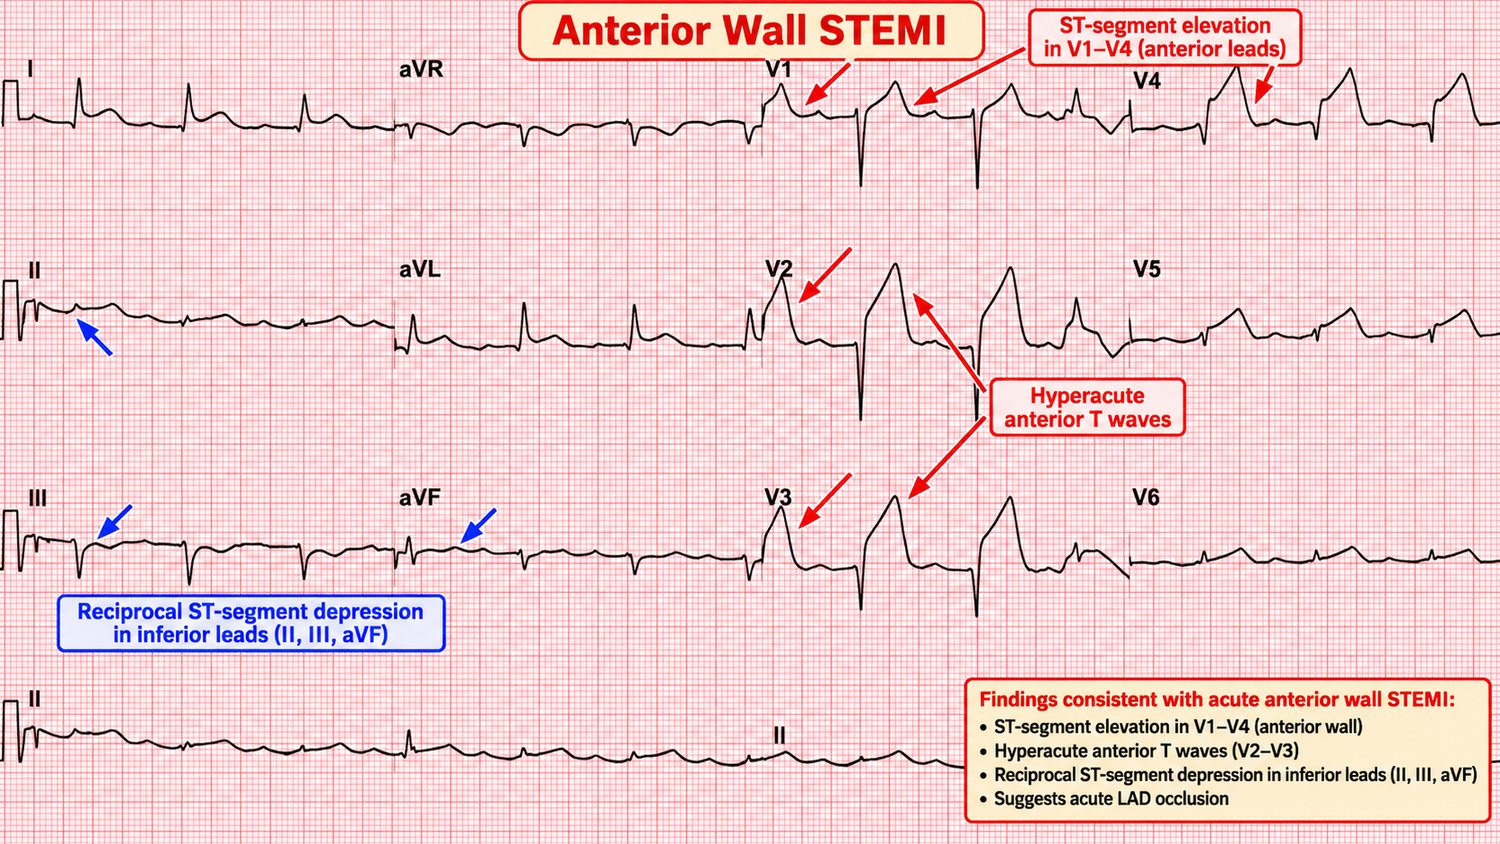
Anterior / anteroseptal STEMI (LAD)
ST elevation in the precordial leads (V1–V4, extending to V5–V6 in large infarcts) means occlusion of the left anterior descending artery. These are large-territory infarcts with the highest risk of cardiogenic shock, arrhythmia and death; a proximal LAD lesion may add new RBBB or high-lateral involvement.
Lateral STEMI
ST elevation in I, aVL and V5–V6 indicates a lateral infarct (circumflex or diagonal). Isolated circumflex occlusions are notorious for being electrically silent on the standard 12 leads — a reason posterior leads matter (below).
15 · Inferior & posterior MI
Inferior STEMI
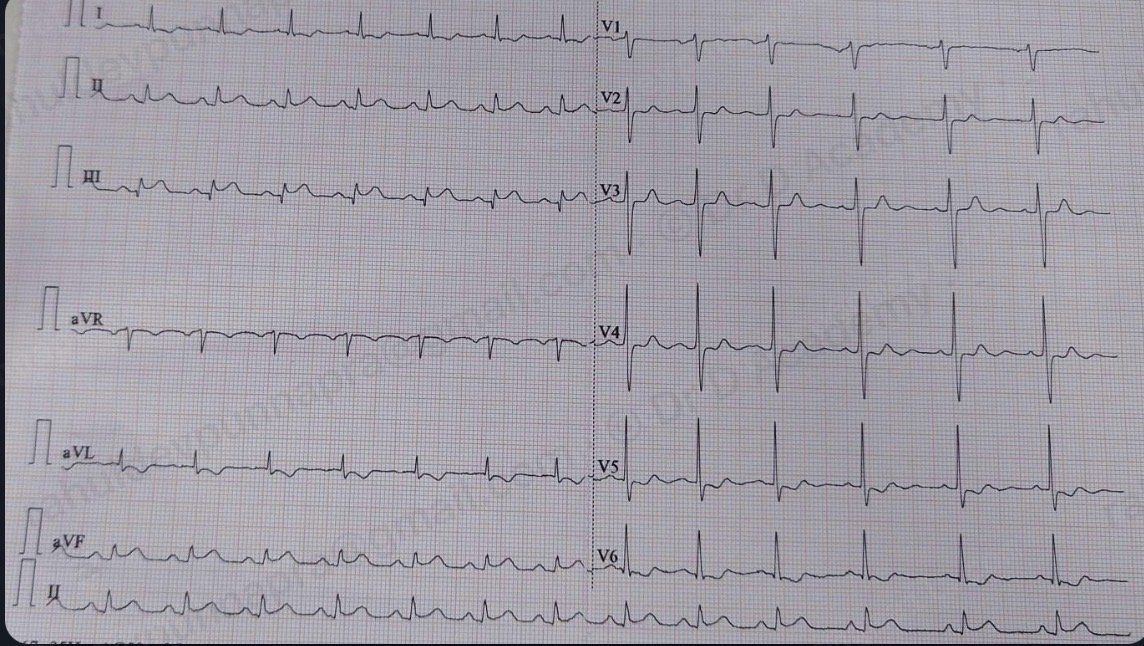
ST elevation in II, III and aVF with reciprocal ST depression in aVL (and often I) indicates an inferior infarct — usually the right coronary artery. Two things must happen next:
- Compare II and III. ST elevation greater in III than II, with reciprocal change in I/aVL, favours an RCA lesion; if lead I is also elevated, suspect a circumflex culprit.
- Get right-sided leads (V4R). Up to 40% of inferior MIs involve the right ventricle. RV infarction makes the patient preload-dependent.
Posterior MI
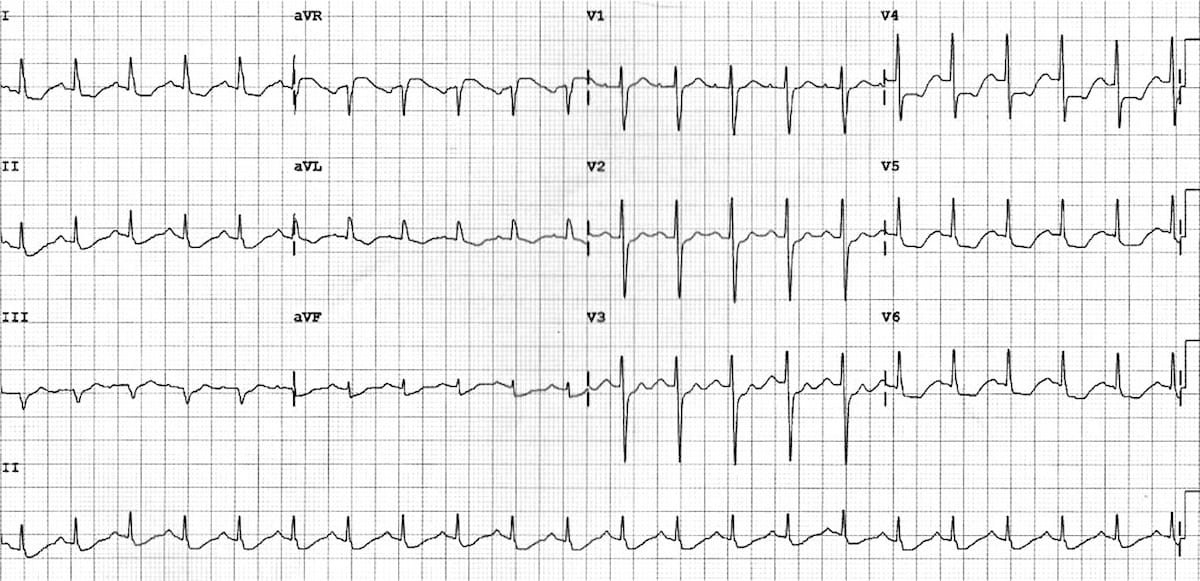
The posterior wall is not seen directly by the standard leads. A posterior infarct therefore shows as its mirror image in V1–V3: horizontal ST depression, tall broad R waves (a "reversed Q"), and upright T waves. Confirm by recording posterior leads V7–V9, where you will see the true ST elevation. Posterior MI often accompanies inferior or lateral infarction.
16 · NSTEMI, Wellens & de Winter
NSTEMI & subendocardial ischaemia
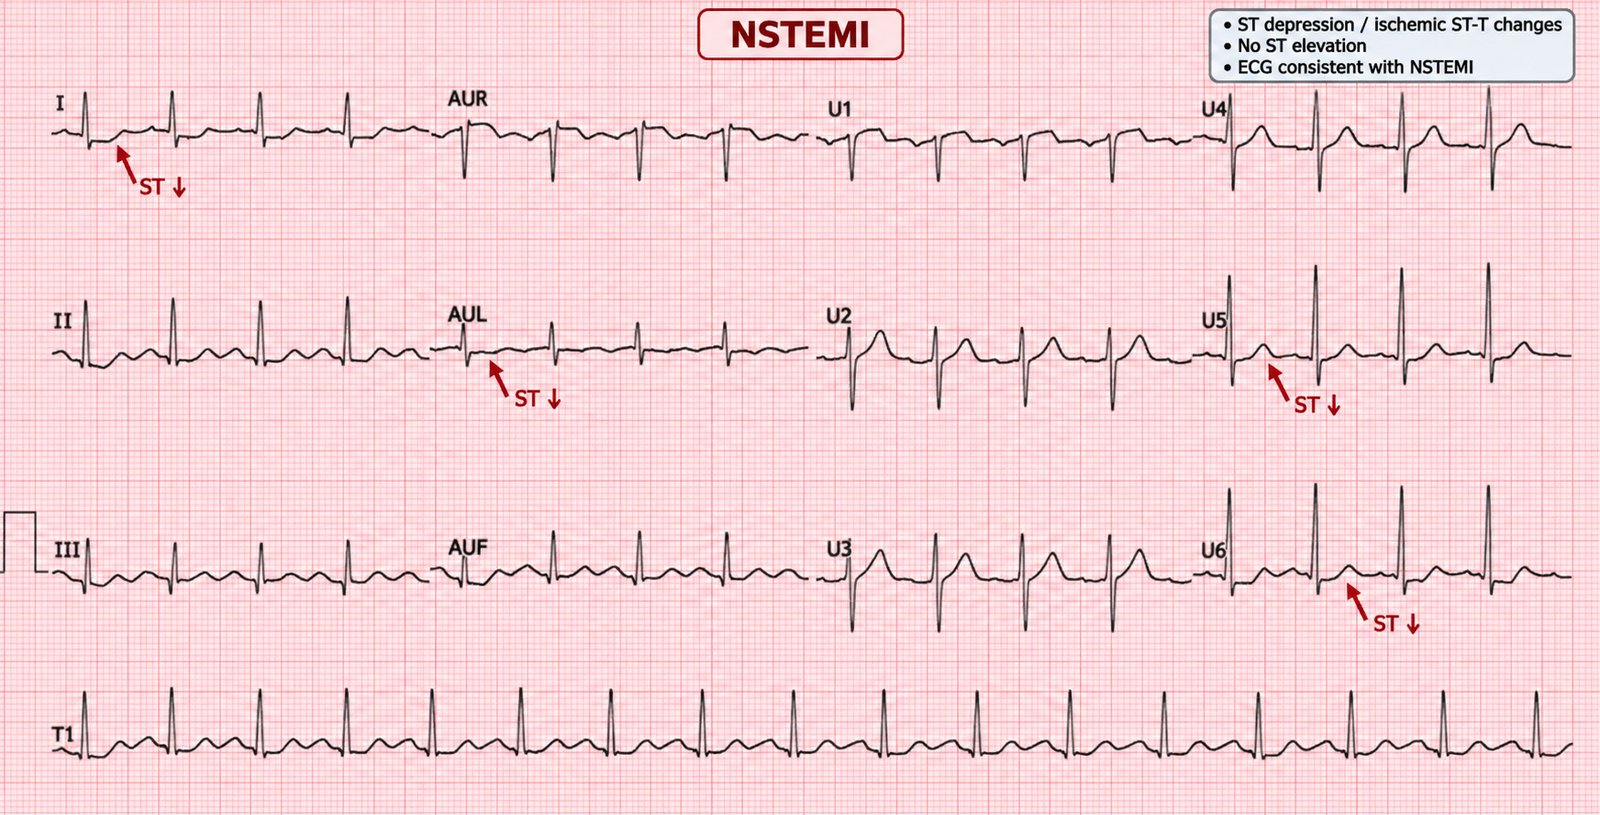
Not every occlusion elevates the ST segment. Subendocardial ischaemia produces ST depression and T-wave inversion without ST elevation — the ECG face of NSTEMI. The diagnosis is clinical plus troponin; the ECG guides risk. Dynamic ST depression, especially if widespread or with haemodynamic instability, marks a high-risk patient.
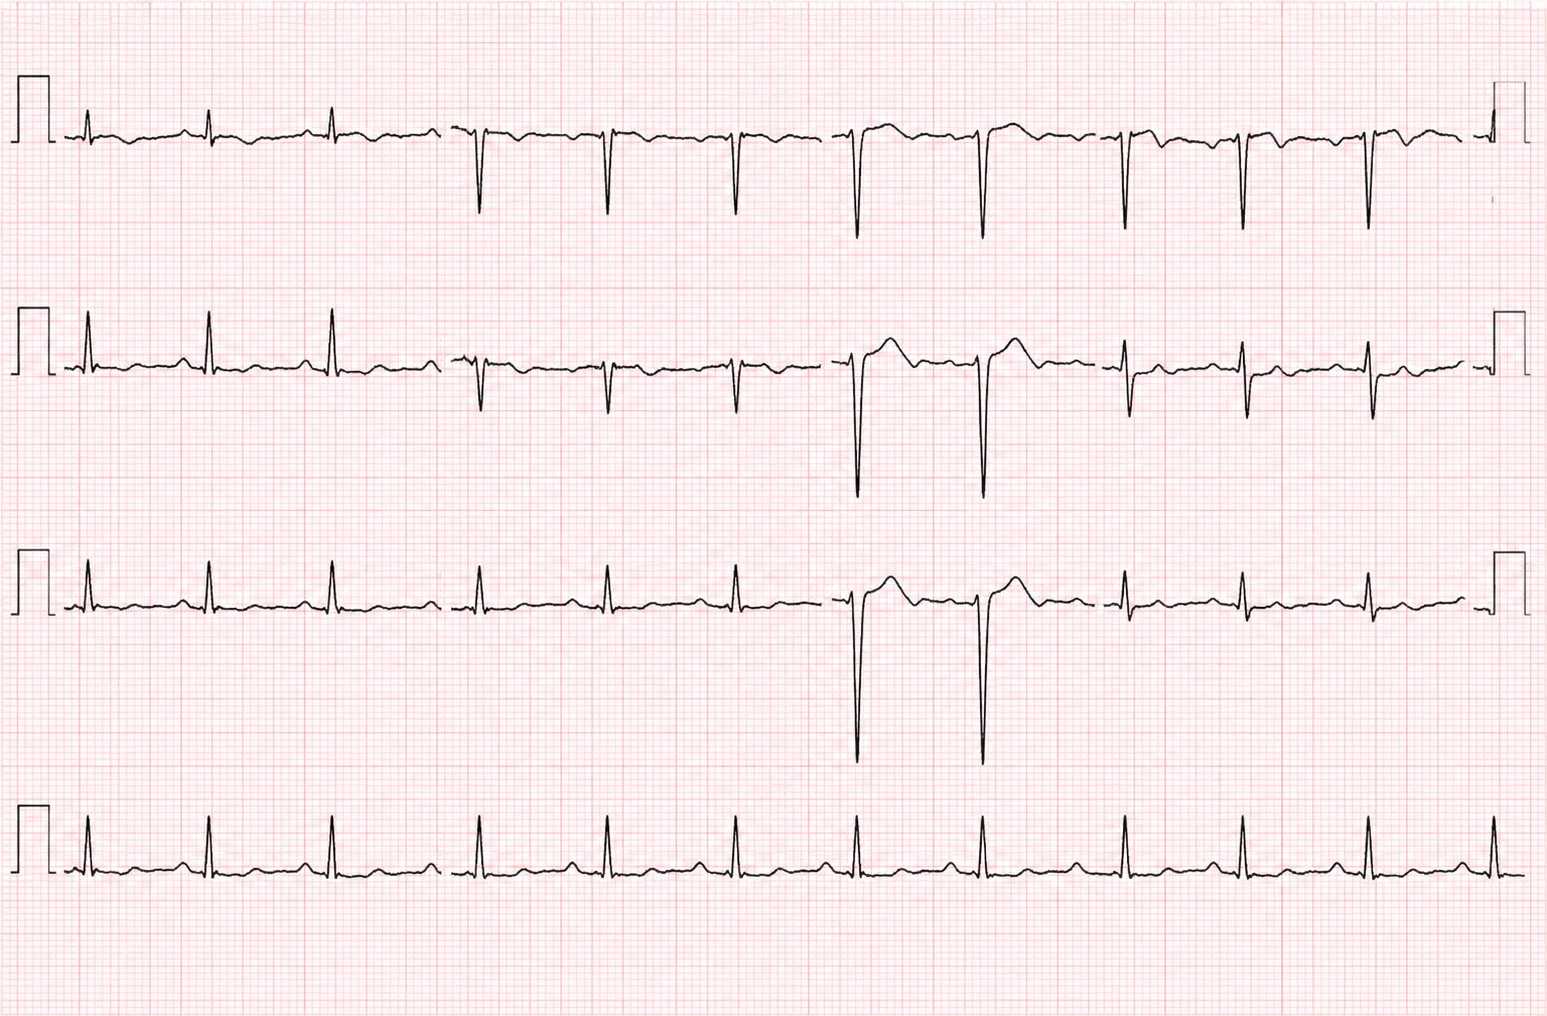
Wellens' syndrome
A warning sign of critical proximal LAD stenosis, seen in the pain-free interval after an anginal episode. There are two types of T-wave change in V2–V3:
- Type A: biphasic T waves.
- Type B: deep, symmetrical T-wave inversion.
The R waves are preserved and there is little or no ST elevation. These patients are at high risk of a large anterior MI within days; they need admission and angiography, not a stress test (which can precipitate infarction).
De Winter T waves
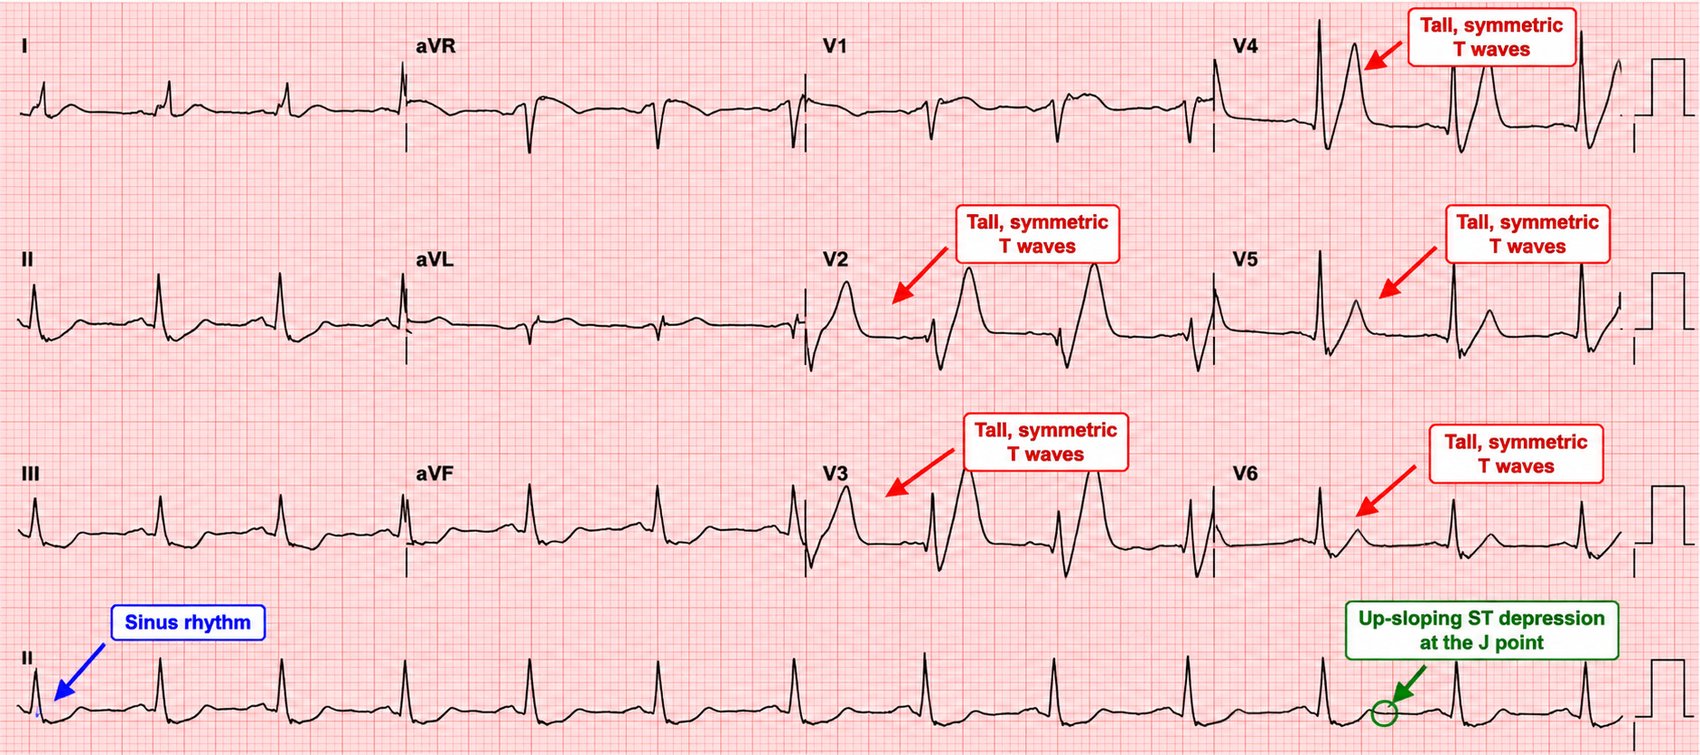
A STEMI-equivalent that never elevates the ST segment: upsloping ST depression at the J point in V1–V6, continuing into tall, symmetrical T waves, often with slight ST elevation in aVR. It indicates acute proximal LAD occlusion and warrants immediate reperfusion just like a STEMI.
17 · OMI, Sgarbossa & the STEMI mimics
The OMI paradigm
The traditional "STEMI vs NSTEMI" divide misses occlusions that do not meet voltage criteria. The occlusion MI (OMI) concept reframes the question as: is there acute coronary occlusion that will benefit from immediate reperfusion? — regardless of millimetres. The subtle patterns above (de Winter, posterior, hyperacute T waves, subtle straightening with reciprocal change) are OMIs to catch.
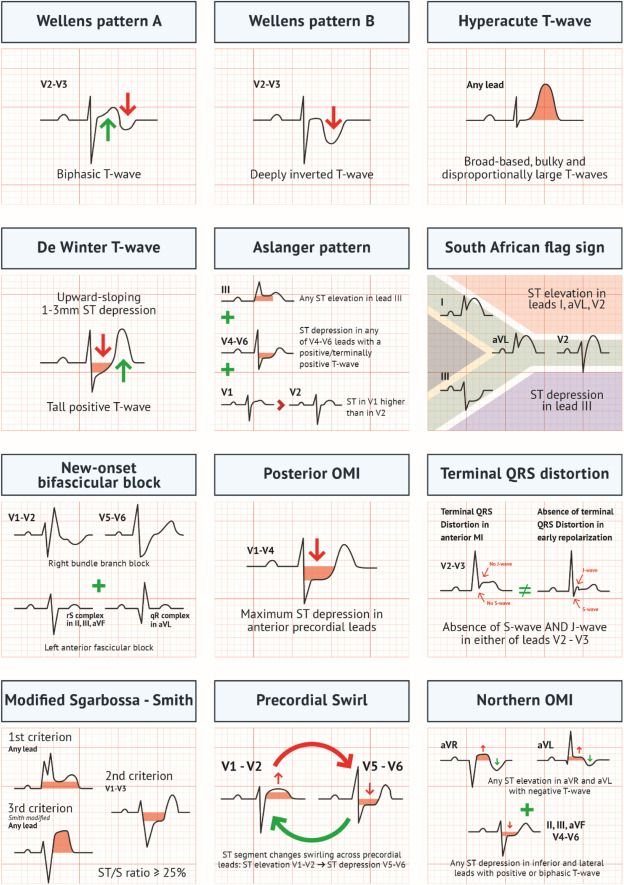
Diagnosing MI through LBBB or a paced rhythm — the Sgarbossa criteria
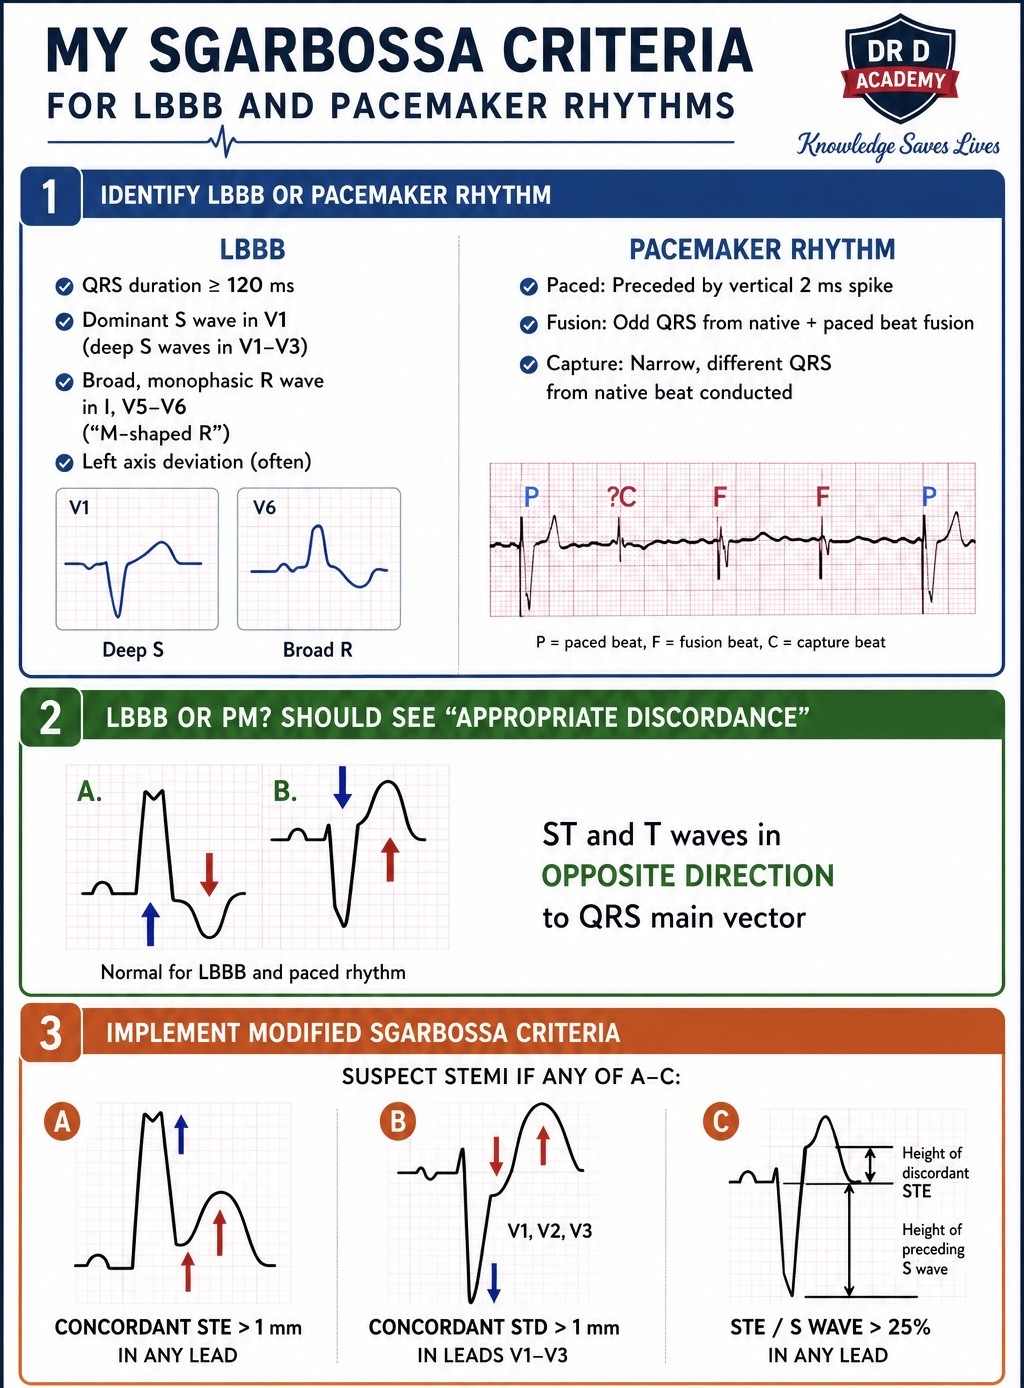
LBBB and ventricular pacing both produce secondary ST/T changes that mask infarction. The Sgarbossa criteria identify infarction despite them:
- Concordant ST elevation ≥ 1 mm in any lead (ST elevation in the same direction as the QRS) — most specific.
- Concordant ST depression ≥ 1 mm in V1–V3.
- Excessively discordant ST elevation — the modified (Smith) criterion: ST elevation ≥ 25% of the depth of the preceding S wave.
The common STEMI mimics
| Mimic | Clue that it is not MI |
|---|---|
| Benign early repolarisation | Concave ST elevation, notched J point, young patient, stable over time |
| Pericarditis | Widespread (not territorial) concave ST elevation, PR depression, no reciprocal change (see Ch 18) |
| LVH / LBBB | High voltages / broad QRS with appropriately discordant ST changes |
| Brugada | Coved ST elevation confined to V1–V2 (see Ch 28) |
| Hyperkalaemia | Peaked T waves, broad QRS, small/absent P waves (see Ch 30) |
| Raised ICP / SAH | Deep widespread T-wave inversion, long QT, in the right clinical setting |
18 · Pericarditis vs early repolarisation
Both cause ST elevation in a young, often well patient — and both are frequently confused with STEMI.
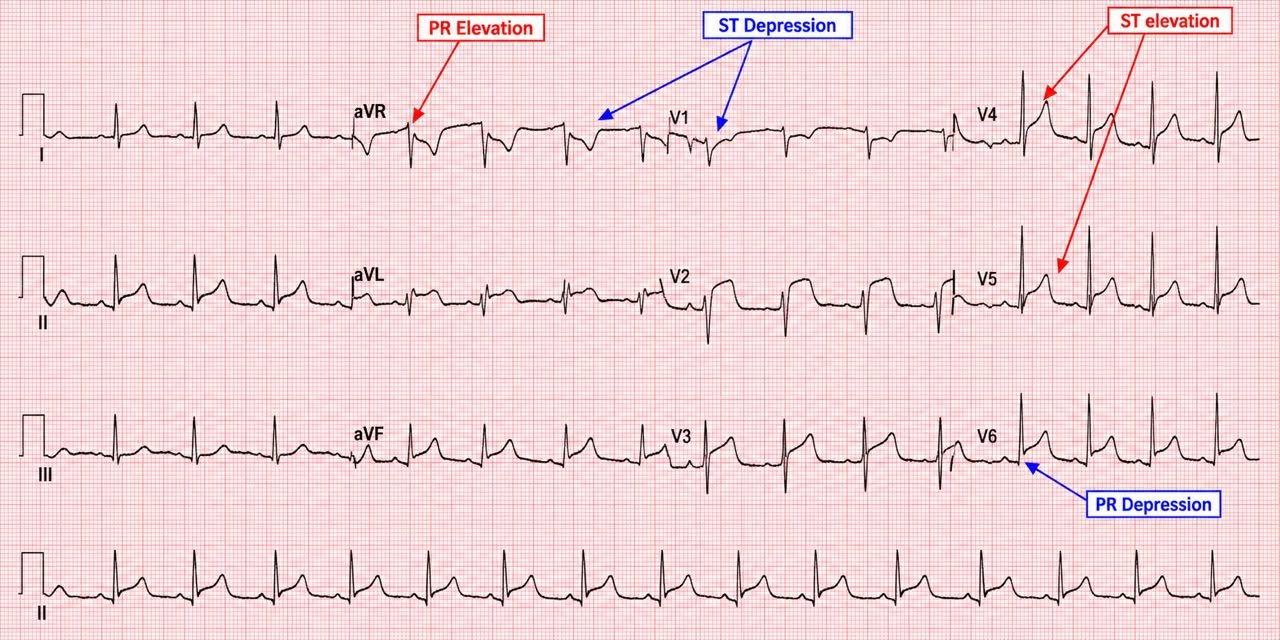
Acute pericarditis
- Widespread concave ("saddle-shaped") ST elevation, crossing coronary territories (e.g. inferior and lateral and anterior).
- PR depression (and PR elevation in aVR) — a specific early sign.
- No reciprocal ST depression (except in aVR/V1).
- Spodick's sign (downsloping TP segment) and, clinically, pleuritic pain relieved by sitting forward and a friction rub.
Benign early repolarisation
A normal variant, common in young fit men. Concave ST elevation, most marked in the precordial leads, with a notched or slurred J point and prominent, concordant T waves. It is stable over time and lacks reciprocal change. The distinction from pericarditis can be subtle; the ST-elevation-to-T-wave ratio and PR depression help.
Part IV · Arrhythmias
Arrhythmias look intimidating because there are so many names. In fact almost every rhythm can be placed with three questions: Is it fast or slow? Is the QRS narrow or broad? Is it regular or irregular? Answer those and the differential shrinks to a handful. This part gives you that framework and then works through each box in it.
19 · A framework for every arrhythmia
Whenever a rhythm is abnormal, force it through the same grid before reaching for a name.
| Regular | Irregular | |
|---|---|---|
| Narrow (<120 ms) tachycardia | Sinus tachy, SVT (AVNRT/AVRT), atrial flutter (fixed block), atrial tachycardia | AF, atrial flutter (variable block), MAT |
| Broad (≥120 ms) tachycardia | VT, SVT with aberrancy, antidromic AVRT | AF with BBB/aberrancy, AF in WPW, polymorphic VT / torsades |
| Bradycardia | Sinus brady, junctional escape, complete heart block, 2:1 block | Sinus arrhythmia, AF with slow response, Mobitz I/II |
Two golden rules govern the whole part: a broad-complex tachycardia is VT until proven otherwise, and an unstable patient with a tachyarrhythmia (shock, syncope, ischaemia, heart failure) gets synchronised cardioversion, not a debate about the exact mechanism.
20 · Bradycardias & escape rhythms
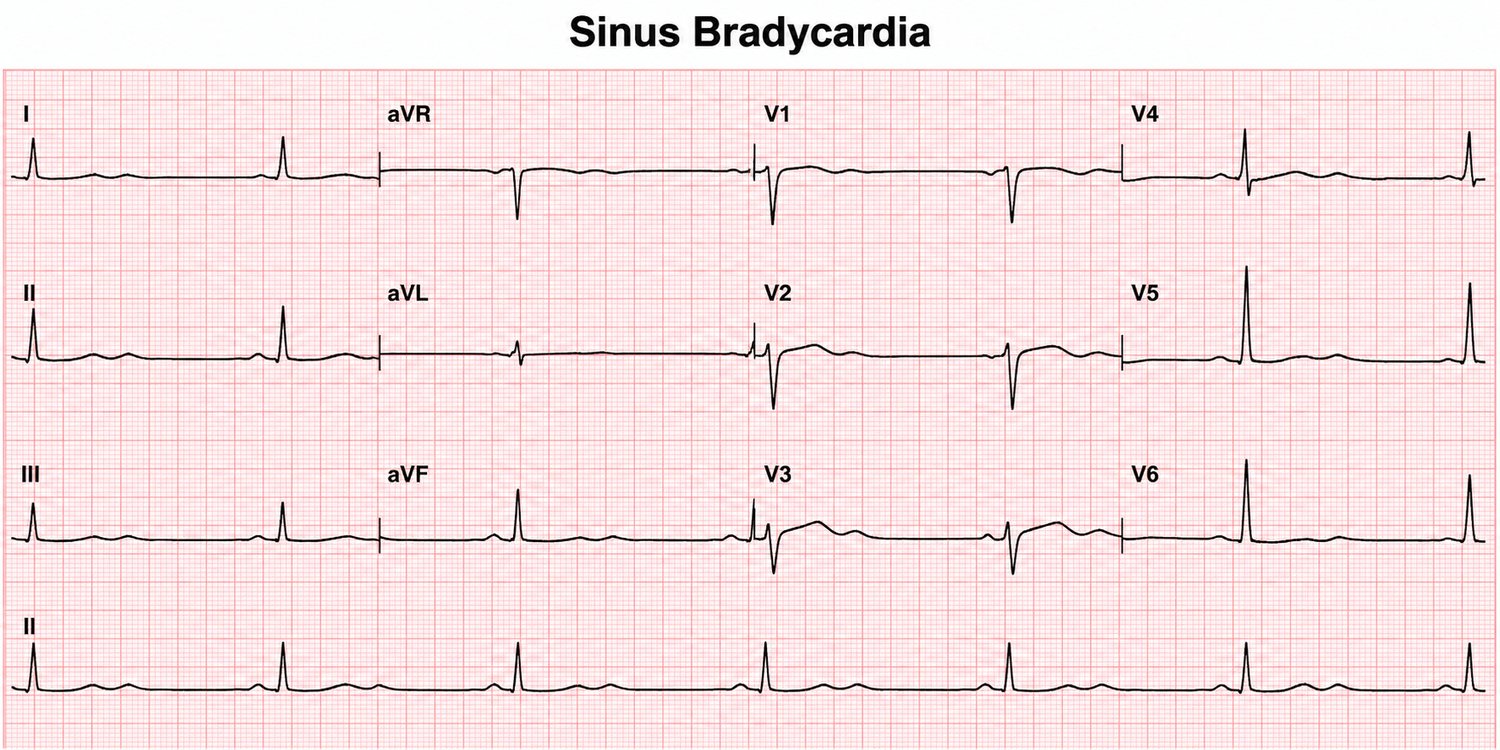
Sinus bradycardia
Normal sinus morphology at < 60 bpm. Common and benign in athletes, sleep and high vagal tone; pathological with drugs (β-blockers, calcium-channel blockers, digoxin), hypothyroidism, raised ICP, hypothermia and inferior ischaemia.
Escape rhythms
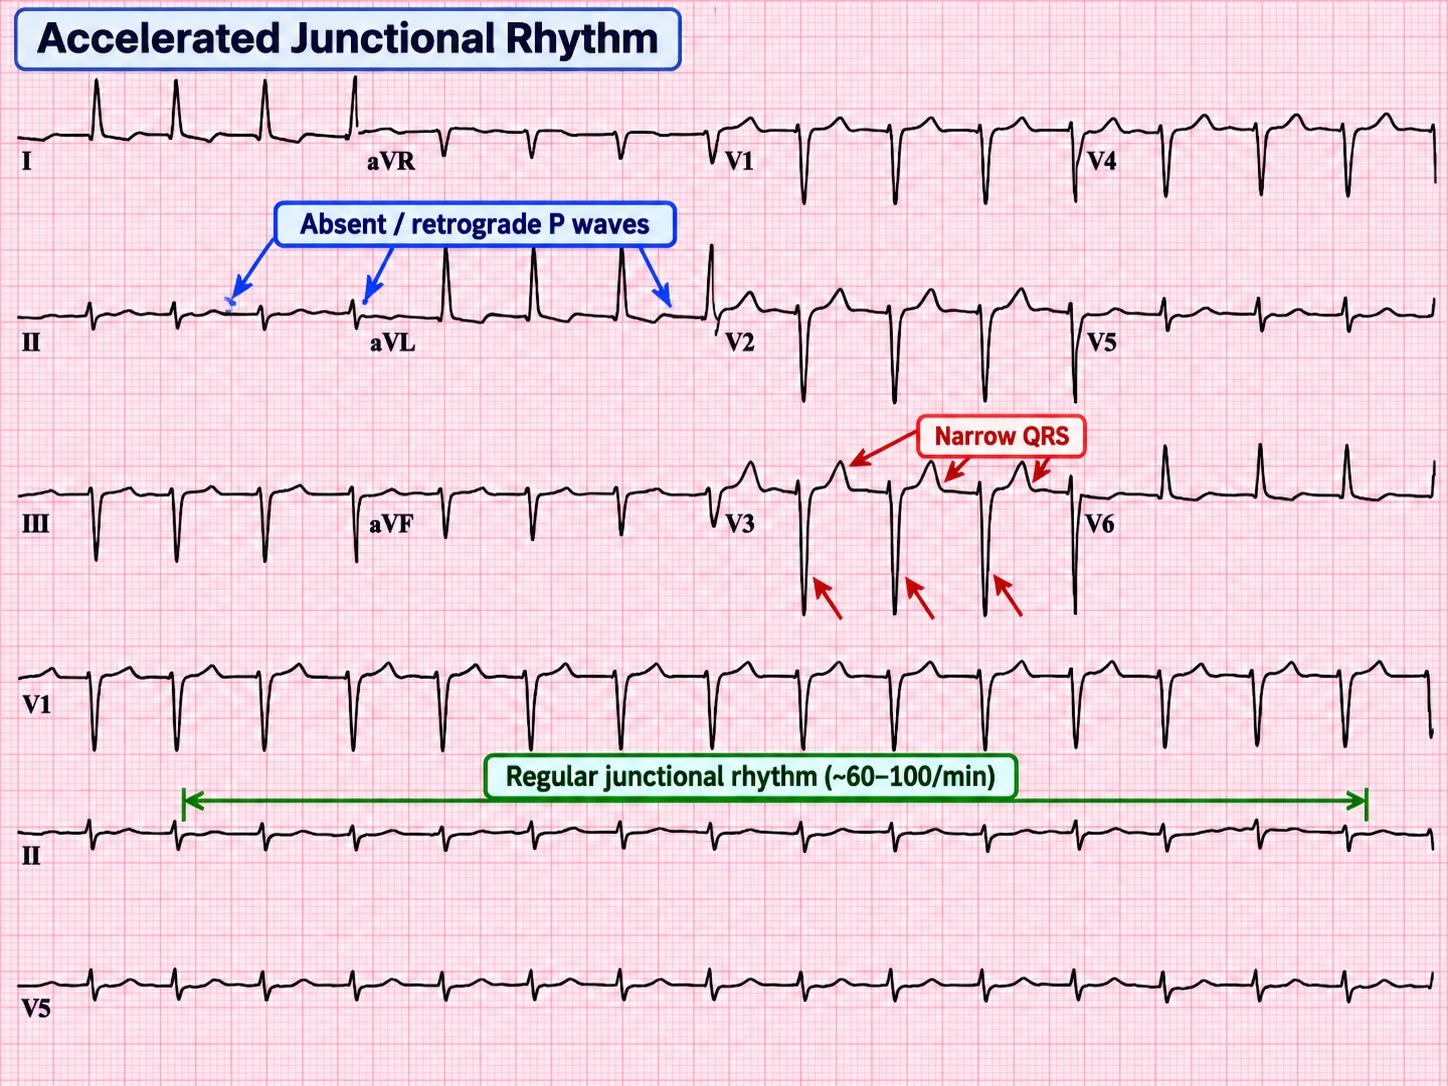
When the sinus node fails or is too slow, a subsidiary pacemaker "escapes." A junctional escape is narrow, regular, at 40–60, with absent or inverted P waves (retrograde atrial activation). A ventricular escape is broad, regular and slow (20–40) — the safety net in complete heart block.
21 · Atrial fibrillation & flutter
Atrial fibrillation
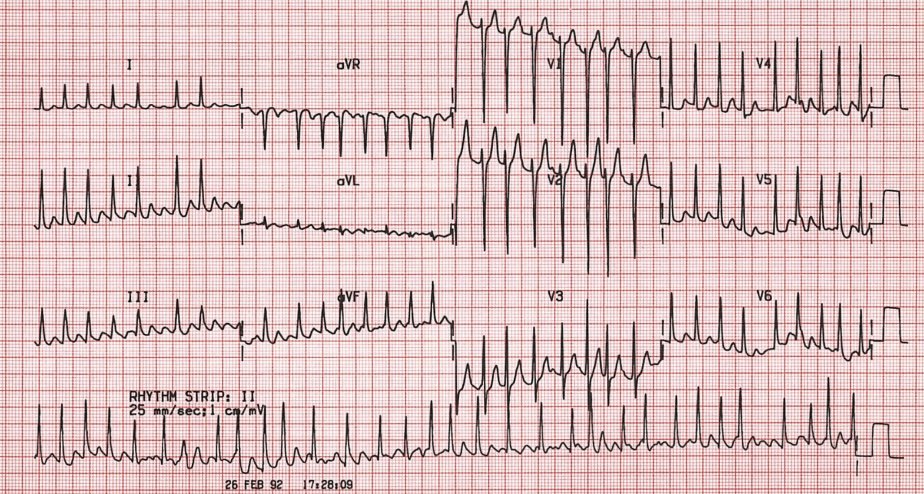
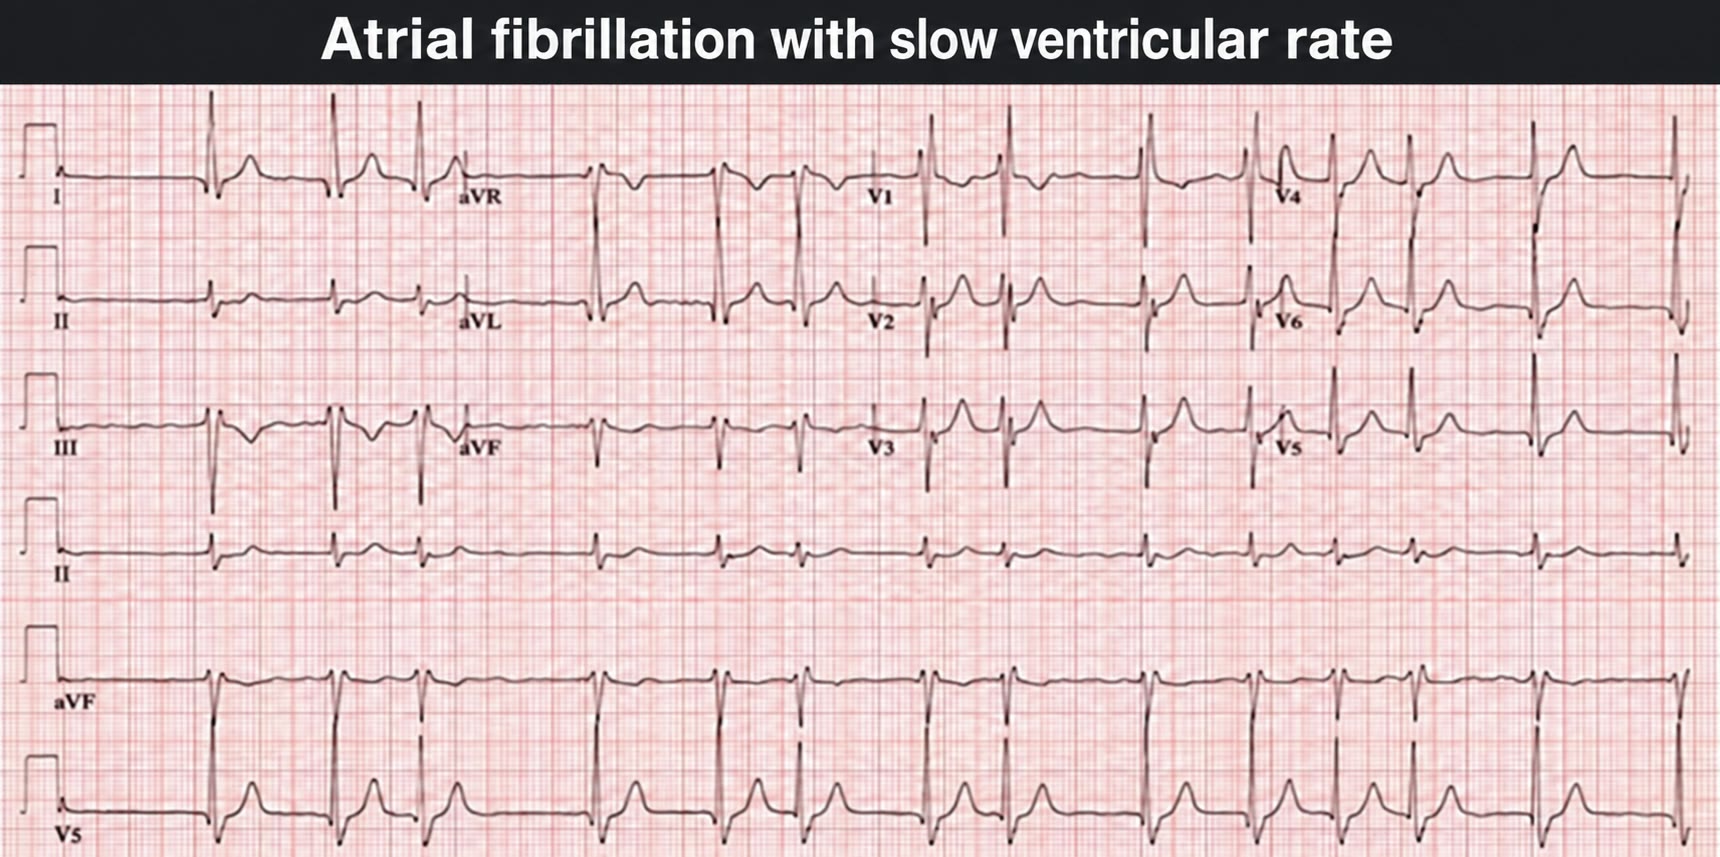
The archetypal irregularly irregular rhythm: chaotic atrial activity with no discernible P waves (a fibrillating baseline) and an irregular ventricular response. Rate depends on AV conduction — "fast AF" with rapid ventricular response, or controlled/slow AF (often drug-related).
Atrial flutter
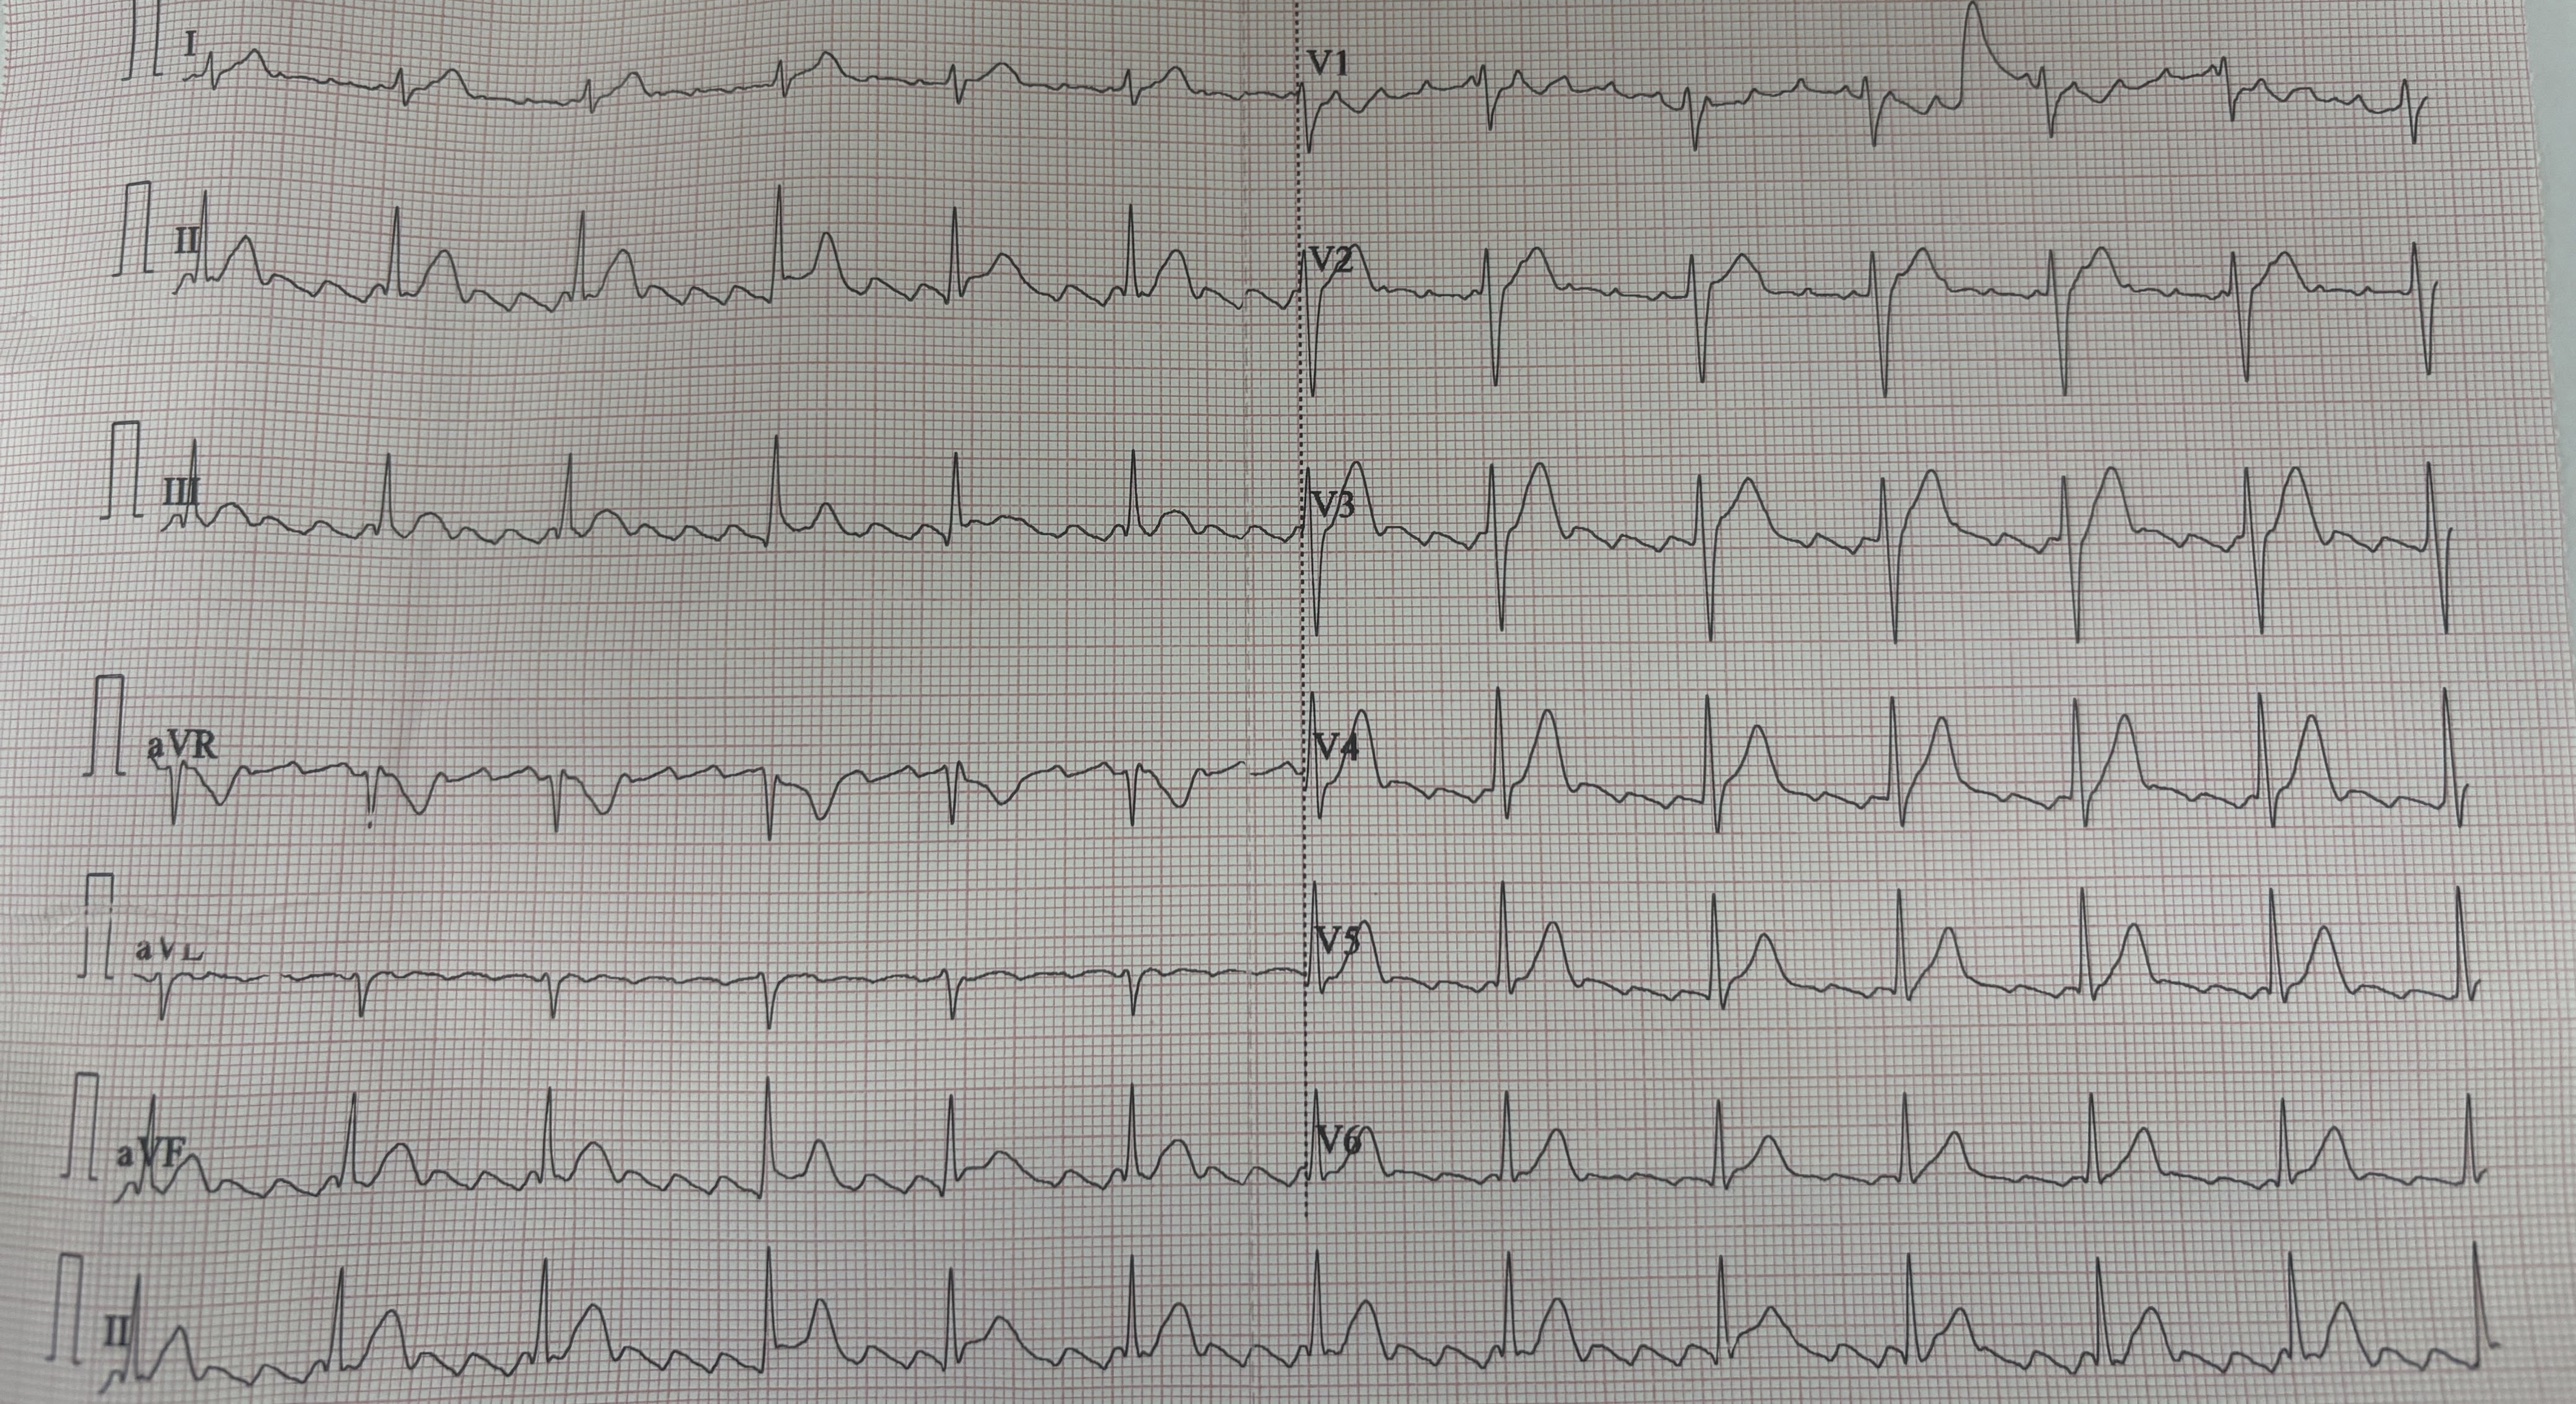
A re-entry circuit in the right atrium at ~300/min, producing a "sawtooth" flutter baseline (best seen in II, III, aVF). The ventricles respond at a fraction of this: 2:1 block gives a suspiciously regular rate of ~150 (the classic clue), 4:1 gives ~75.
Management principles
For both, decide: rate vs rhythm control, and anticoagulation based on stroke risk (CHA₂DS₂-VASc). If the patient is unstable, or AF is clearly < 48 h in a suitable patient, consider cardioversion. Never cardiovert AF of uncertain or > 48 h duration without addressing thromboembolic risk first.
↑ Contents22 · The narrow-complex tachycardias (SVT)
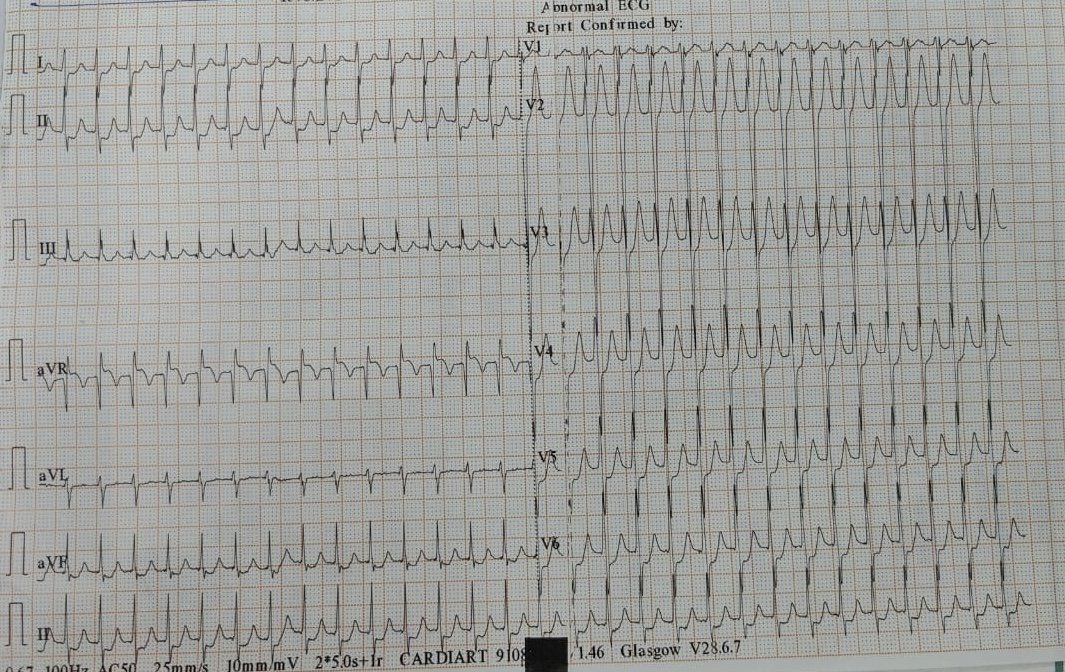
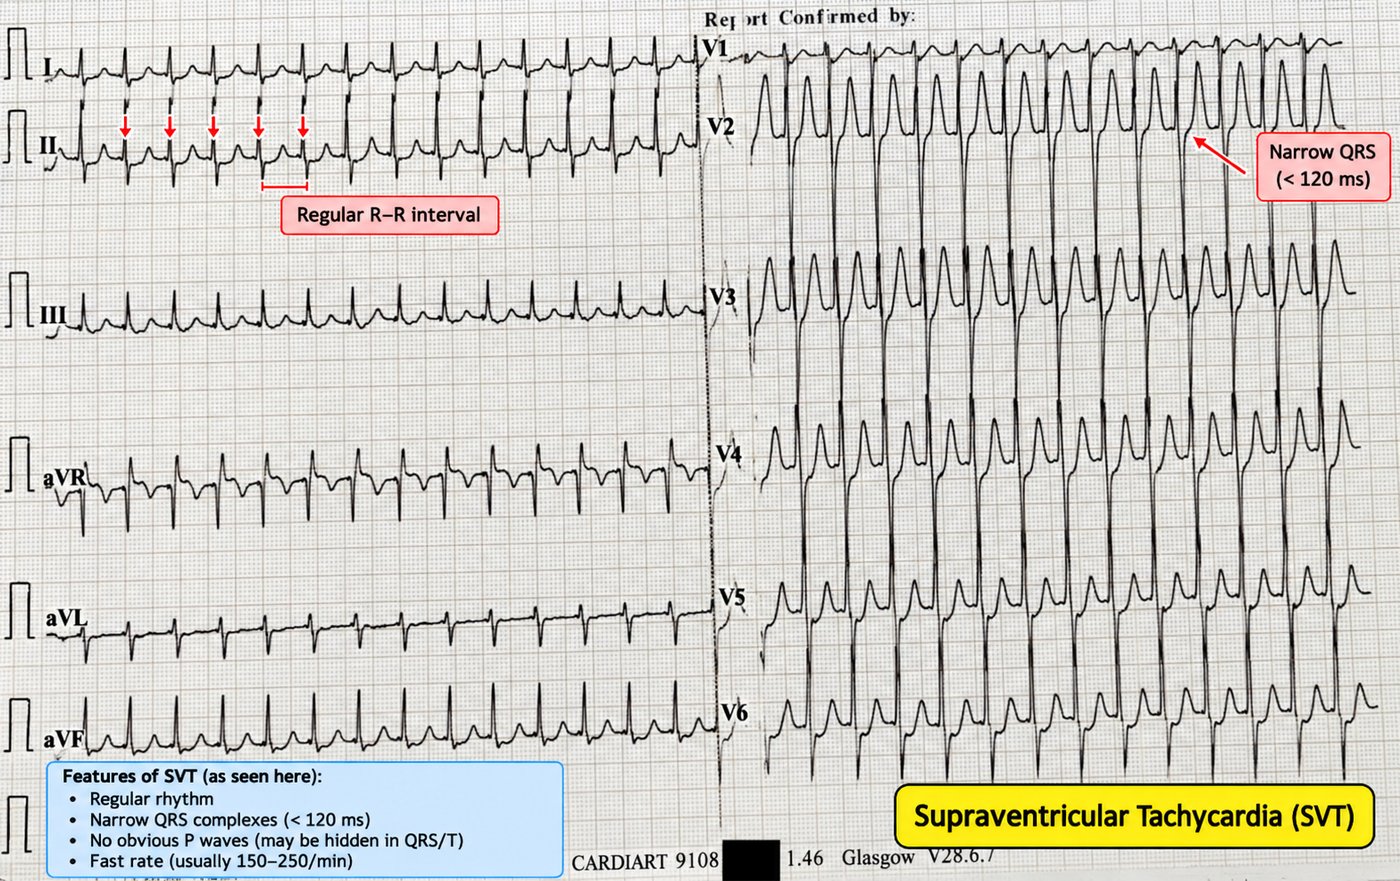
A regular narrow-complex tachycardia with no visible P waves at 140–250/min is usually a re-entrant supraventricular tachycardia — most often AVNRT (re-entry within the AV node) or AVRT (re-entry using an accessory pathway, as in WPW).
Management of stable SVT
- Vagal manoeuvres — the modified Valsalva is the most effective.
- Adenosine 6 mg rapid IV push (then 12 mg, then 18 mg) — it briefly blocks the AV node, terminating AV-nodal-dependent re-entry. Warn the patient of the transient unpleasant flush/chest tightness.
- If unsuccessful and still stable, a rate-limiting agent (e.g. a calcium-channel blocker) may be used.
23 · Ectopics, couplets & non-sustained runs
Premature beats are common and usually benign, but their morphology and frequency carry information.
- Atrial (APC/PAC): an early, abnormally shaped P wave followed by a narrow QRS.
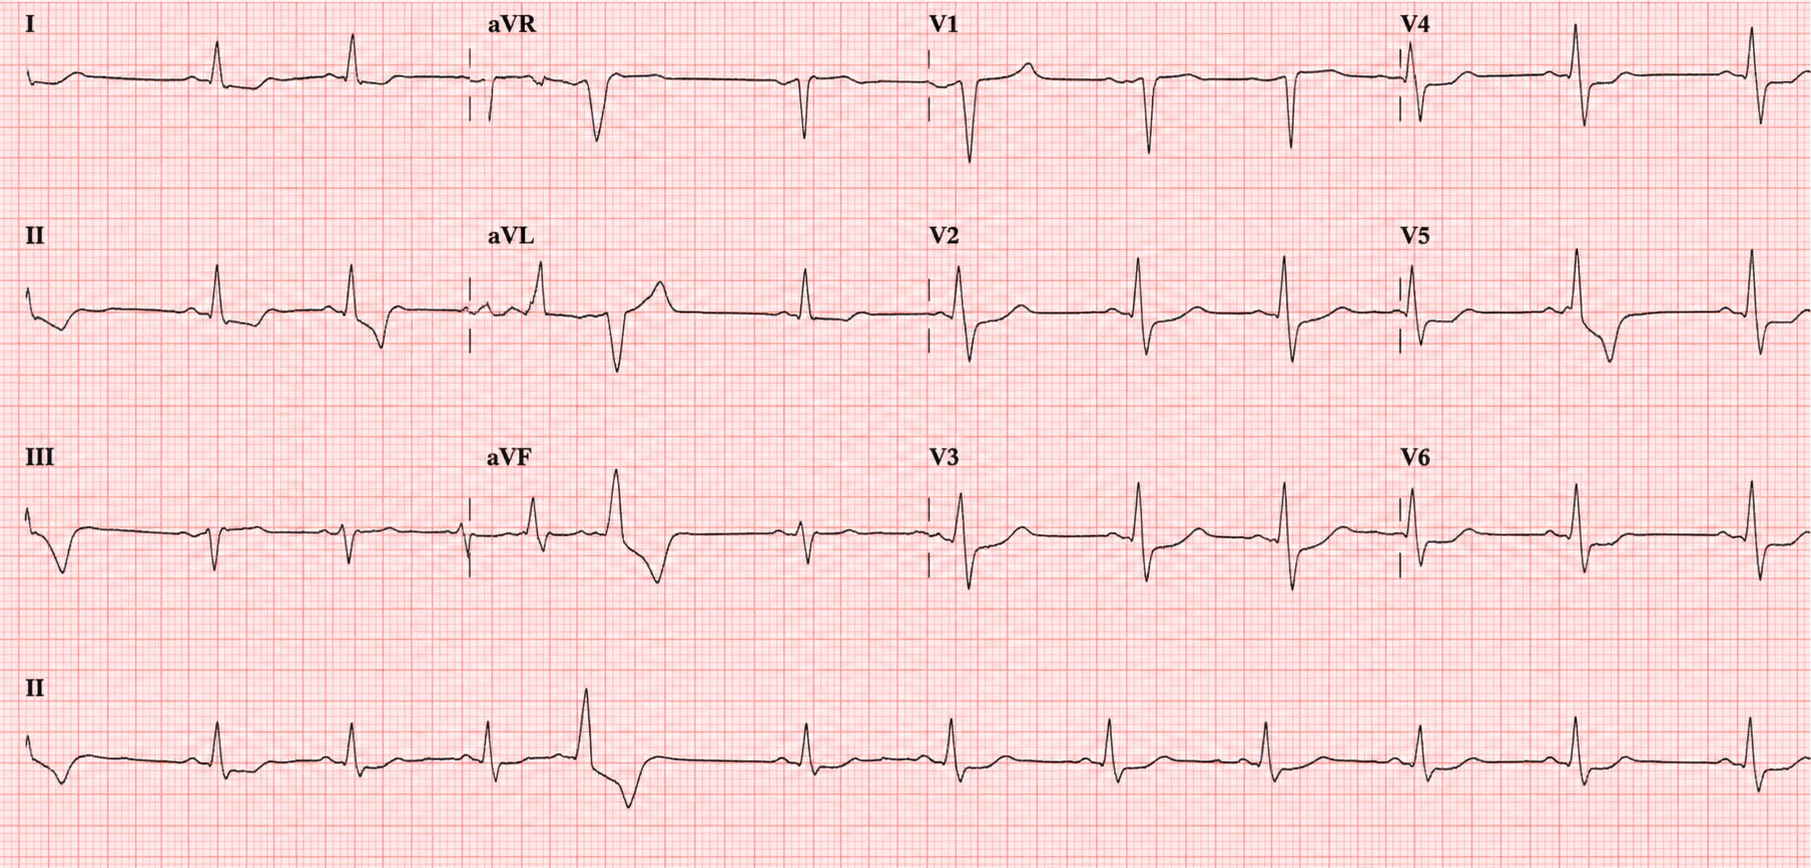
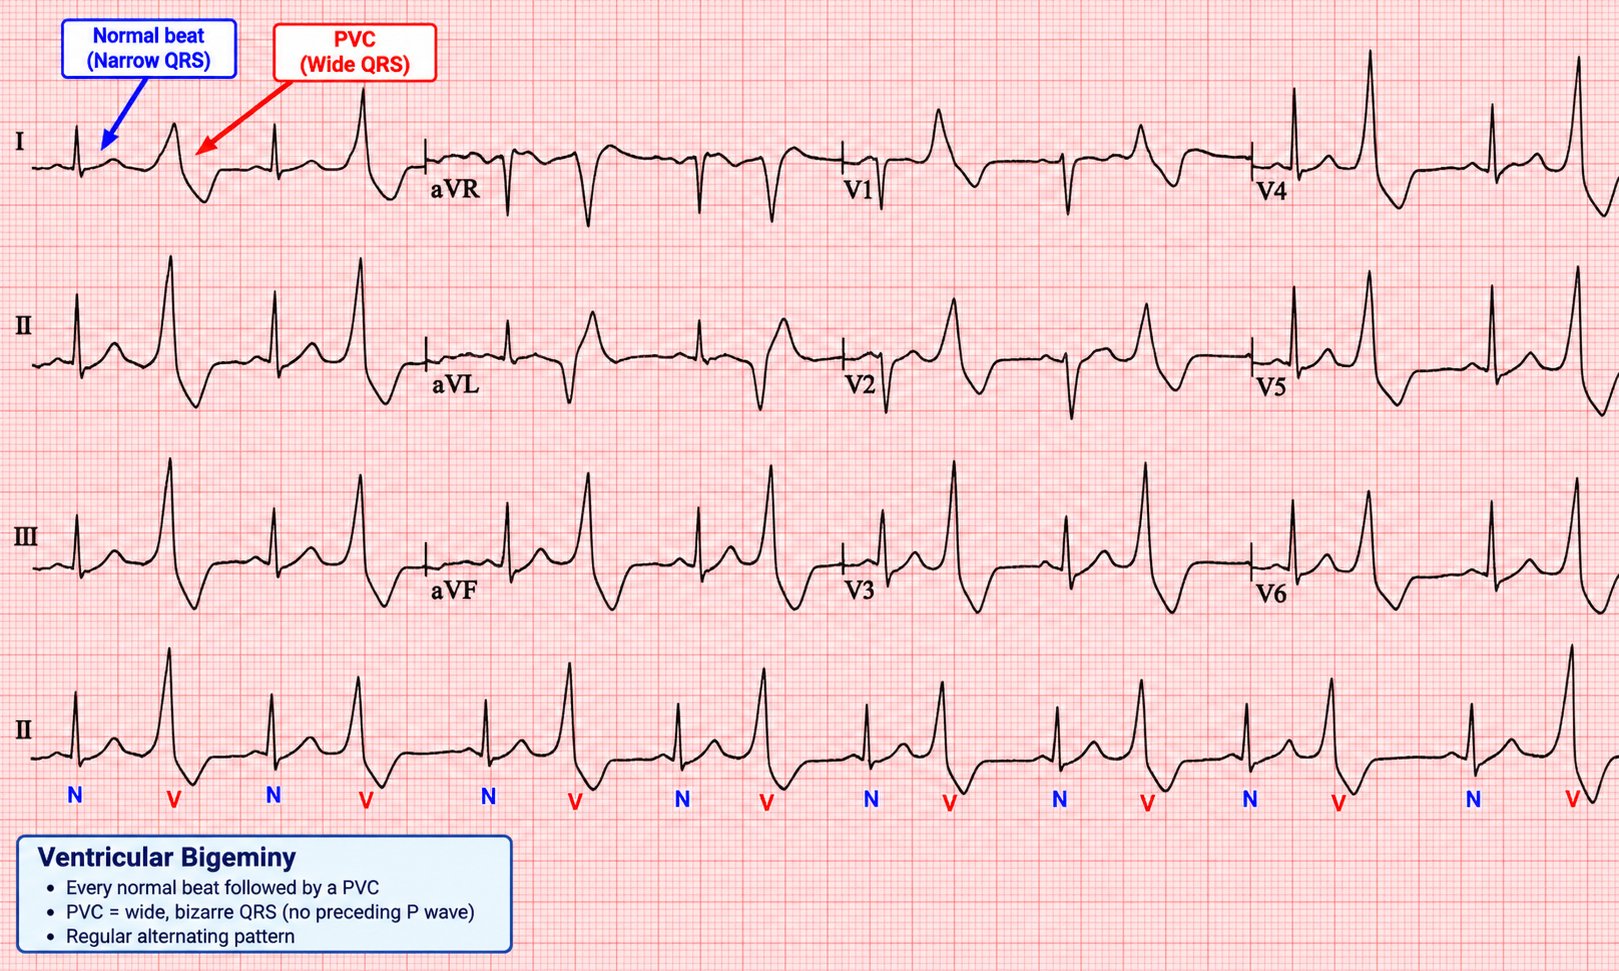
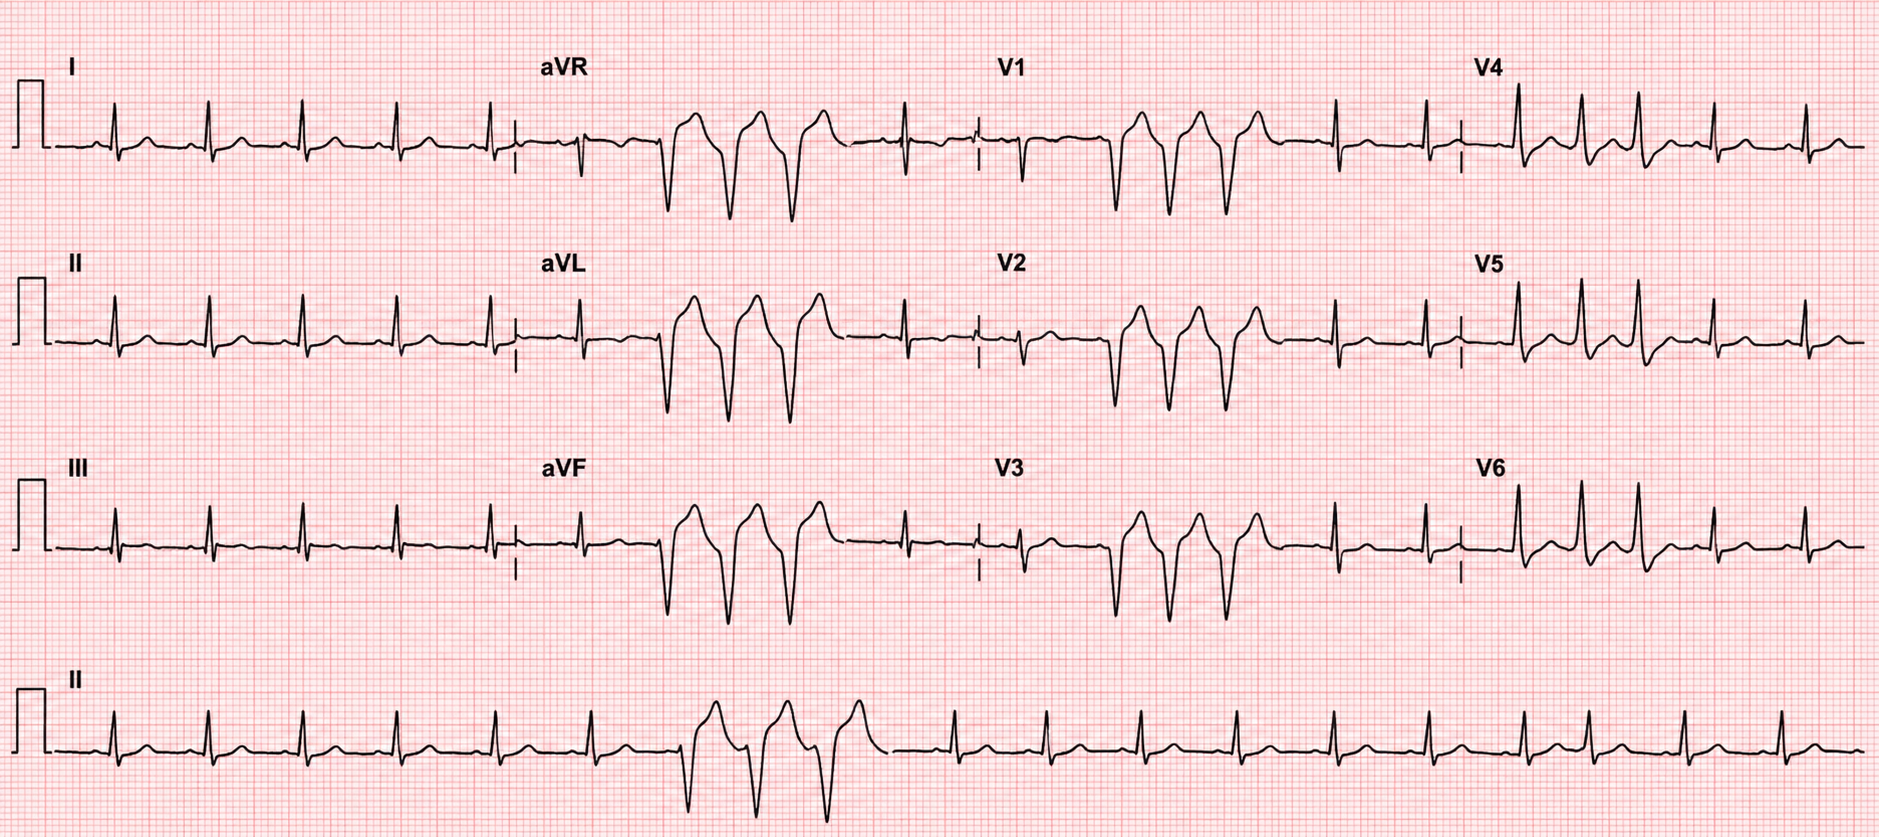
- Ventricular (PVC/VPB): an early, broad QRS with no preceding P and a full compensatory pause. Patterns: bigeminy (every other beat), couplet (two in a row), triplet, and non-sustained VT (≥ 3 consecutive at > 100, lasting < 30 s).
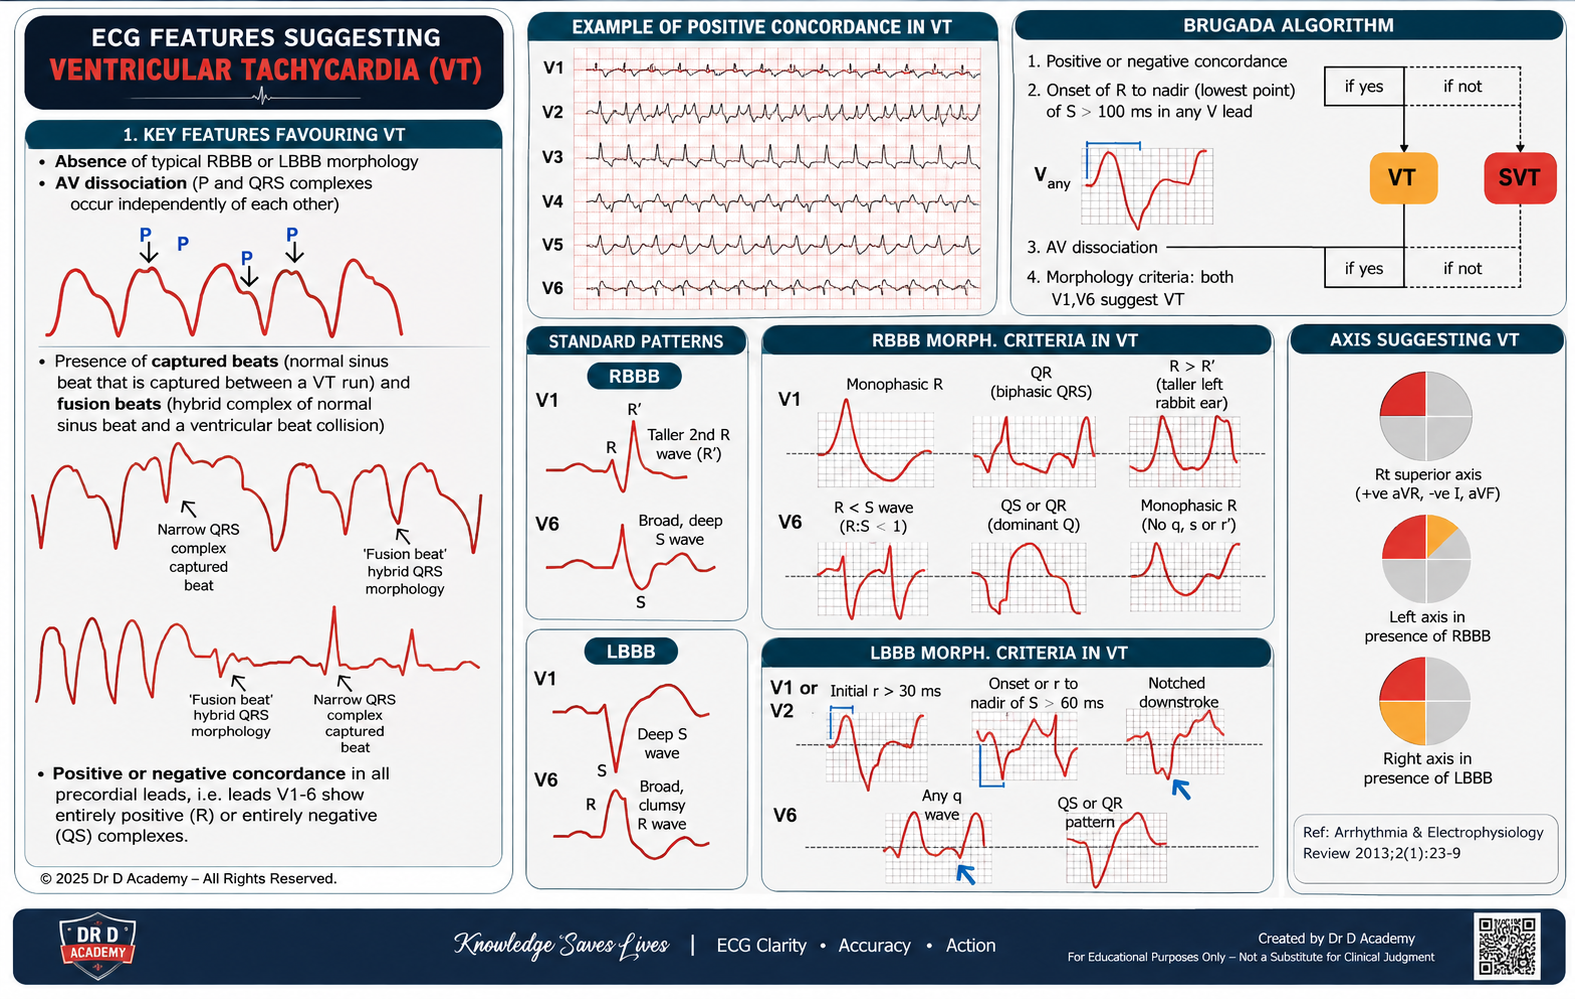
24 · Broad-complex tachycardia — VT until proven otherwise
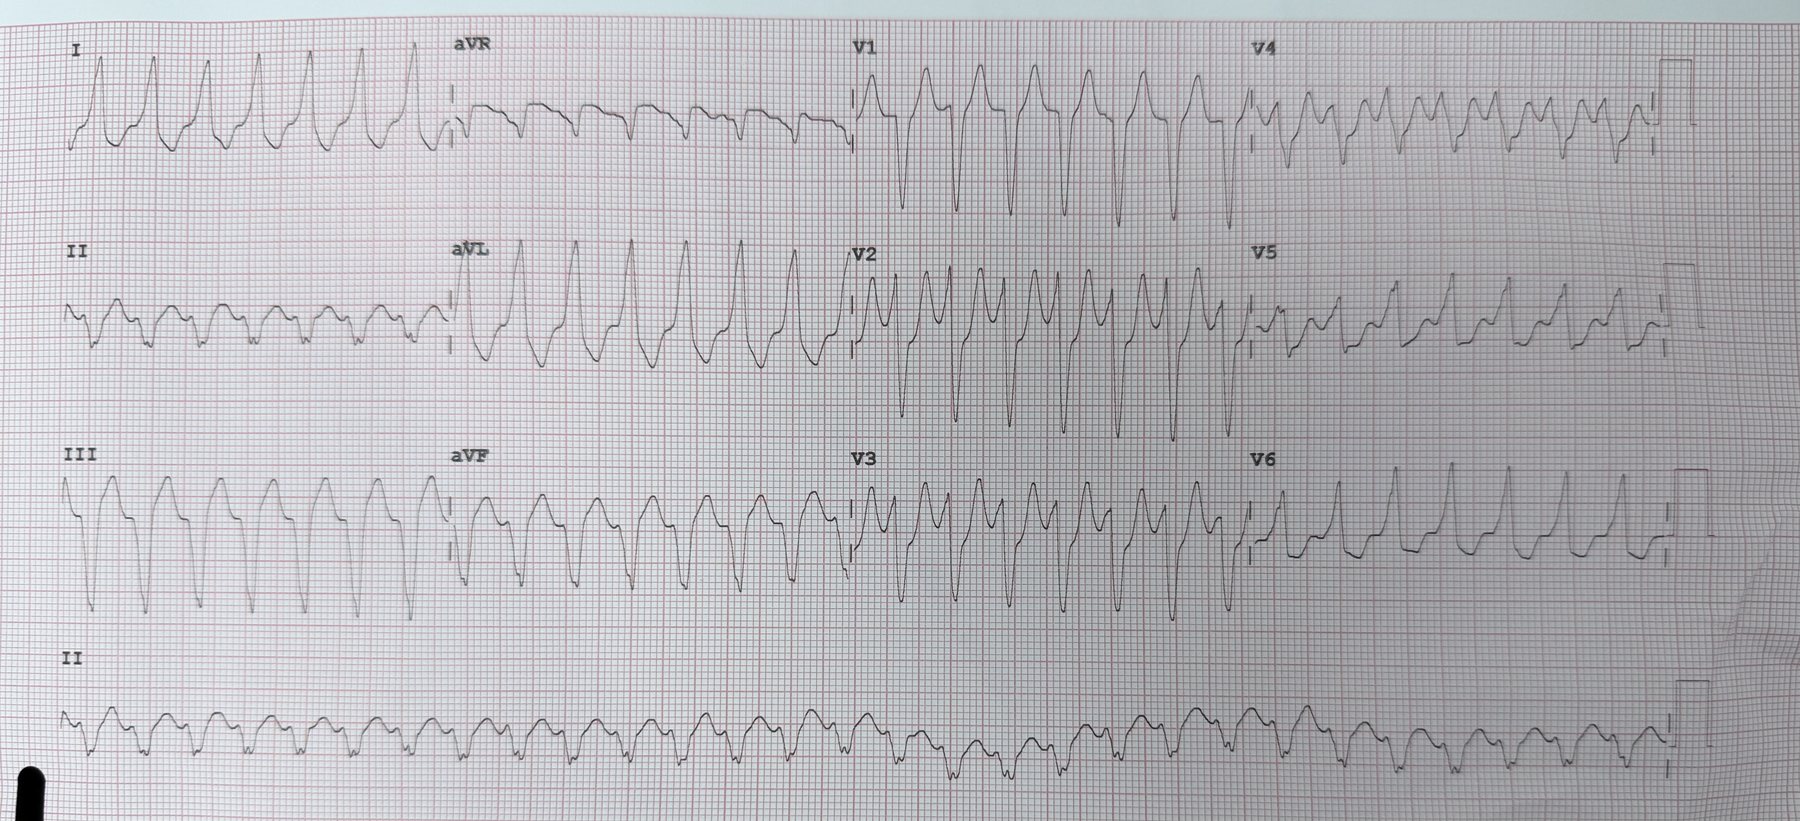
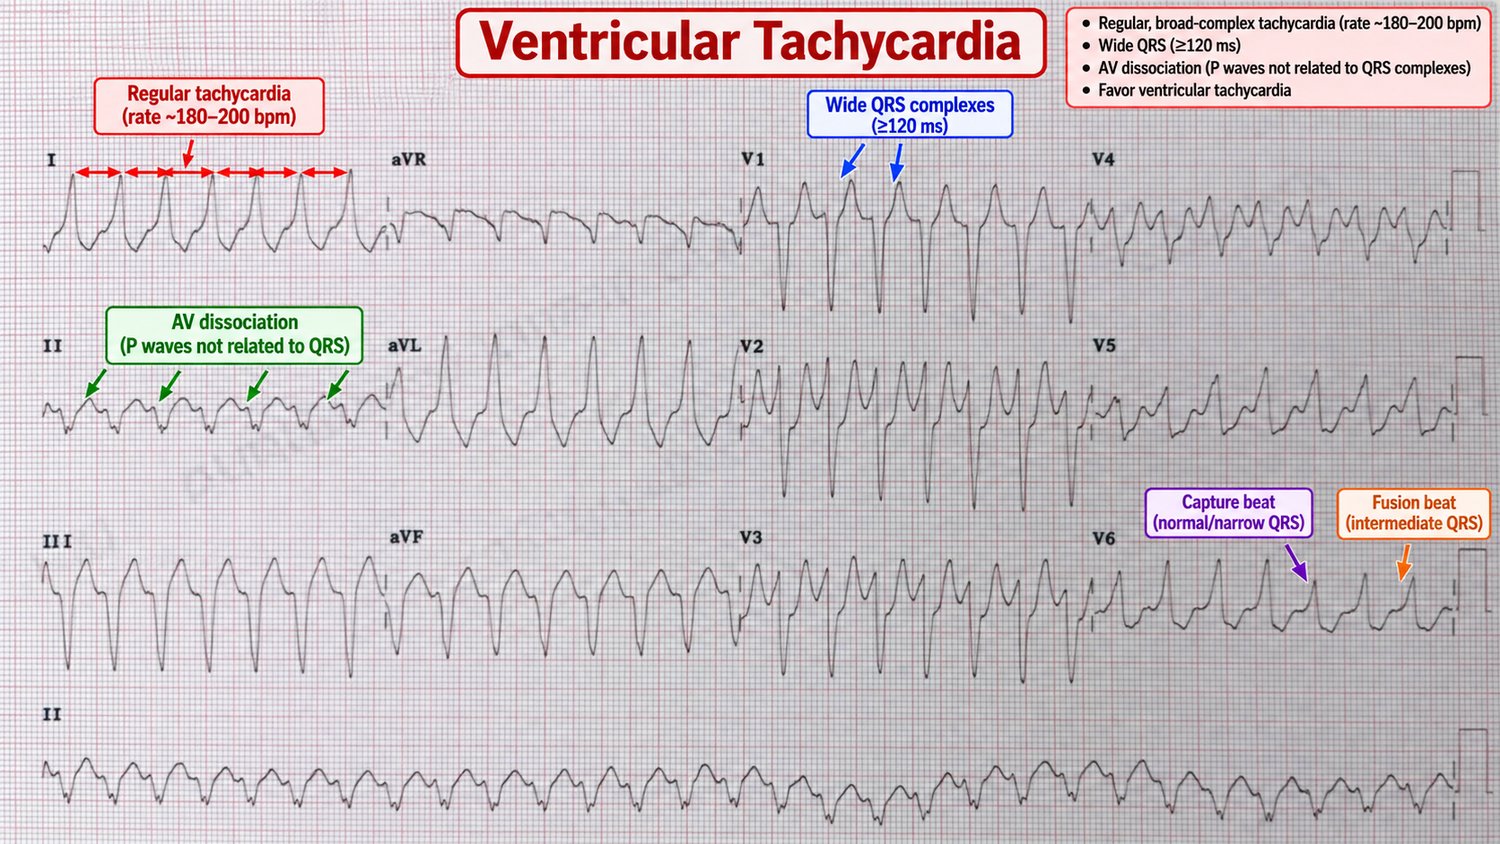
A regular broad-complex tachycardia is ventricular tachycardia in the great majority of cases — and always so in a patient with structural heart disease or prior MI. Misdiagnosing VT as "SVT with aberrancy" and giving a calcium-channel blocker can be lethal. When in doubt, treat as VT.
Features that confirm VT
- AV dissociation — independent P waves marching through (pathognomonic).
- Capture & fusion beats — an occasional normal or hybrid complex.
- Very broad QRS (> 140 ms), extreme ("northwest") axis.
- Concordance — all precordial QRS complexes pointing the same way.
- Any history of ischaemic heart disease (makes VT overwhelmingly likely).
25 · VF, torsades & the peri-arrest rhythms
Ventricular fibrillation
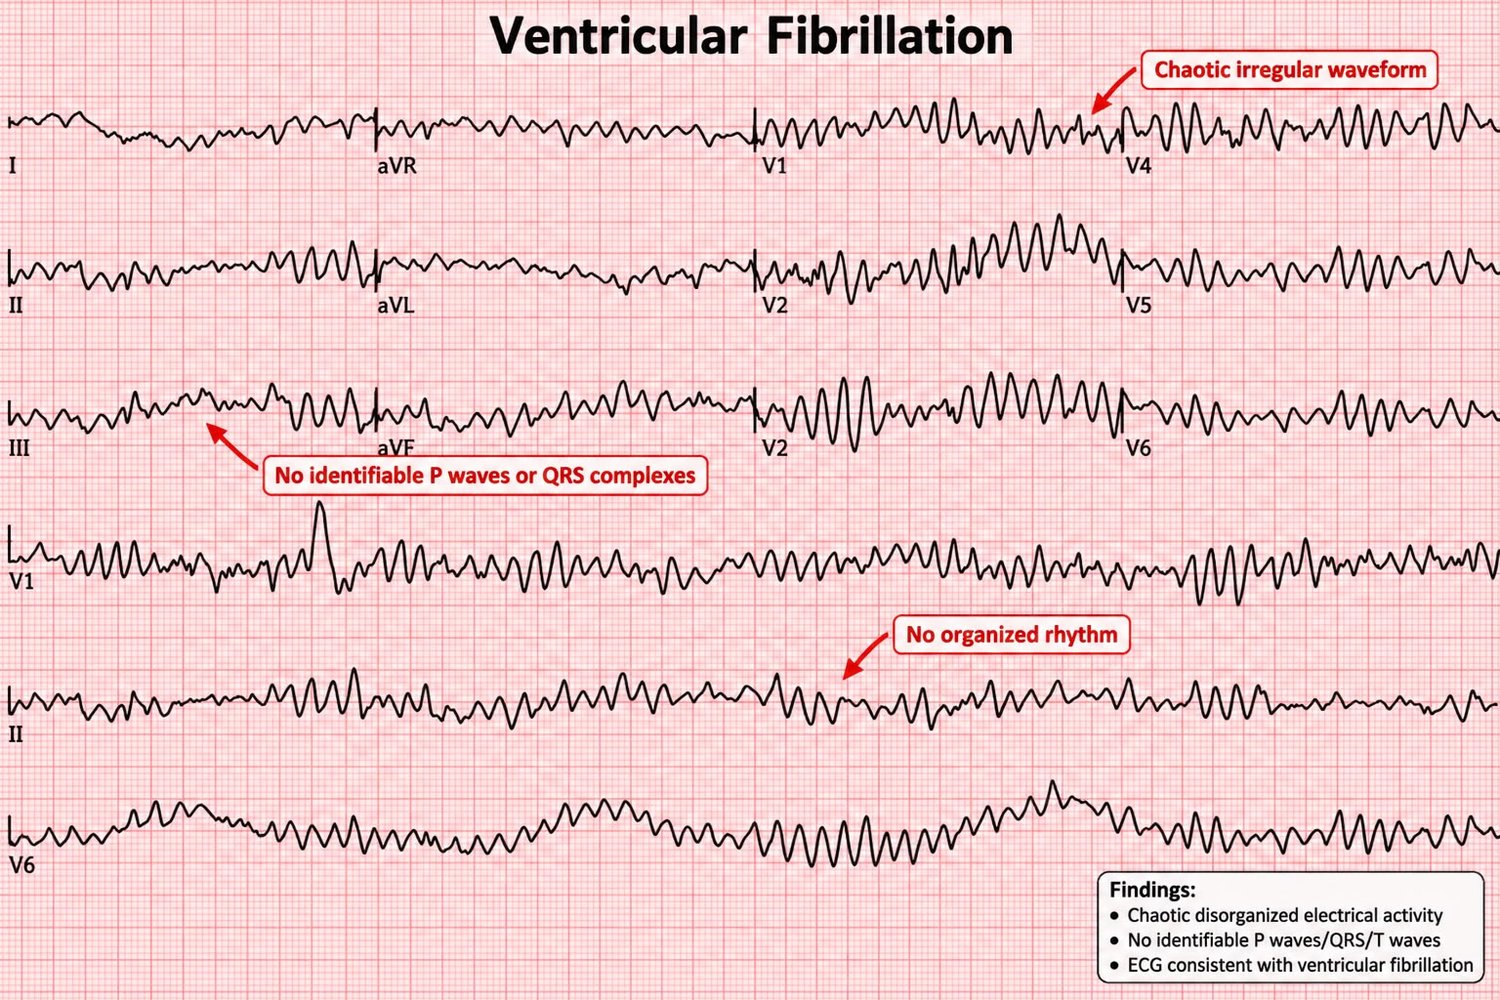
Chaotic, disorganised electrical activity with no identifiable QRS complexes and no cardiac output — a shockable cardiac arrest rhythm. Treatment is immediate defibrillation and high-quality CPR.
Torsades de pointes
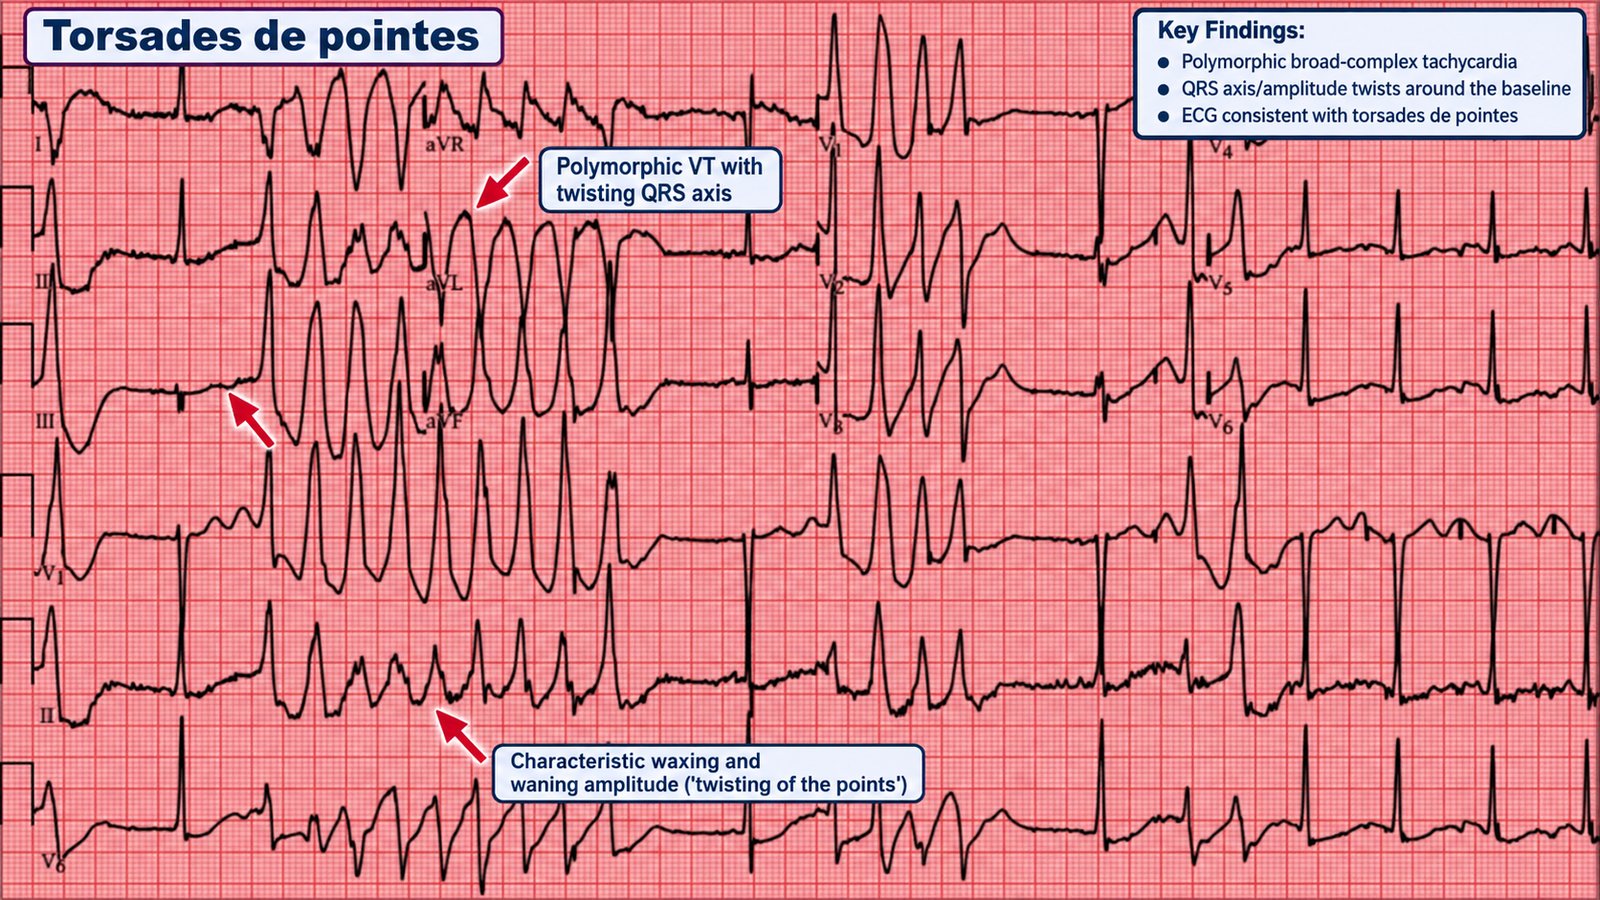
A polymorphic VT on a background of a long QT, in which the QRS axis appears to "twist" around the baseline. It may self-terminate (causing syncope) or degenerate into VF.
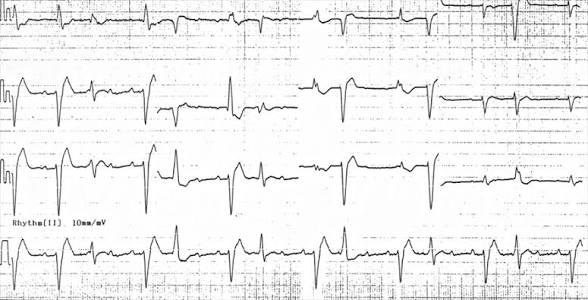
Bidirectional VT
A rare but classic pattern in which the QRS axis alternates beat-to-beat. It is strongly associated with digoxin toxicity (and with catecholaminergic polymorphic VT).
Part V · Pre-excitation & the channelopathies
Some of the most dangerous ECGs belong to young, structurally normal hearts. Accessory pathways and inherited ion-channel disorders produce subtle resting patterns that predict sudden death — and recognising them on a routine tracing is one of the highest-value skills in this book.
26 · WPW & pre-excitation
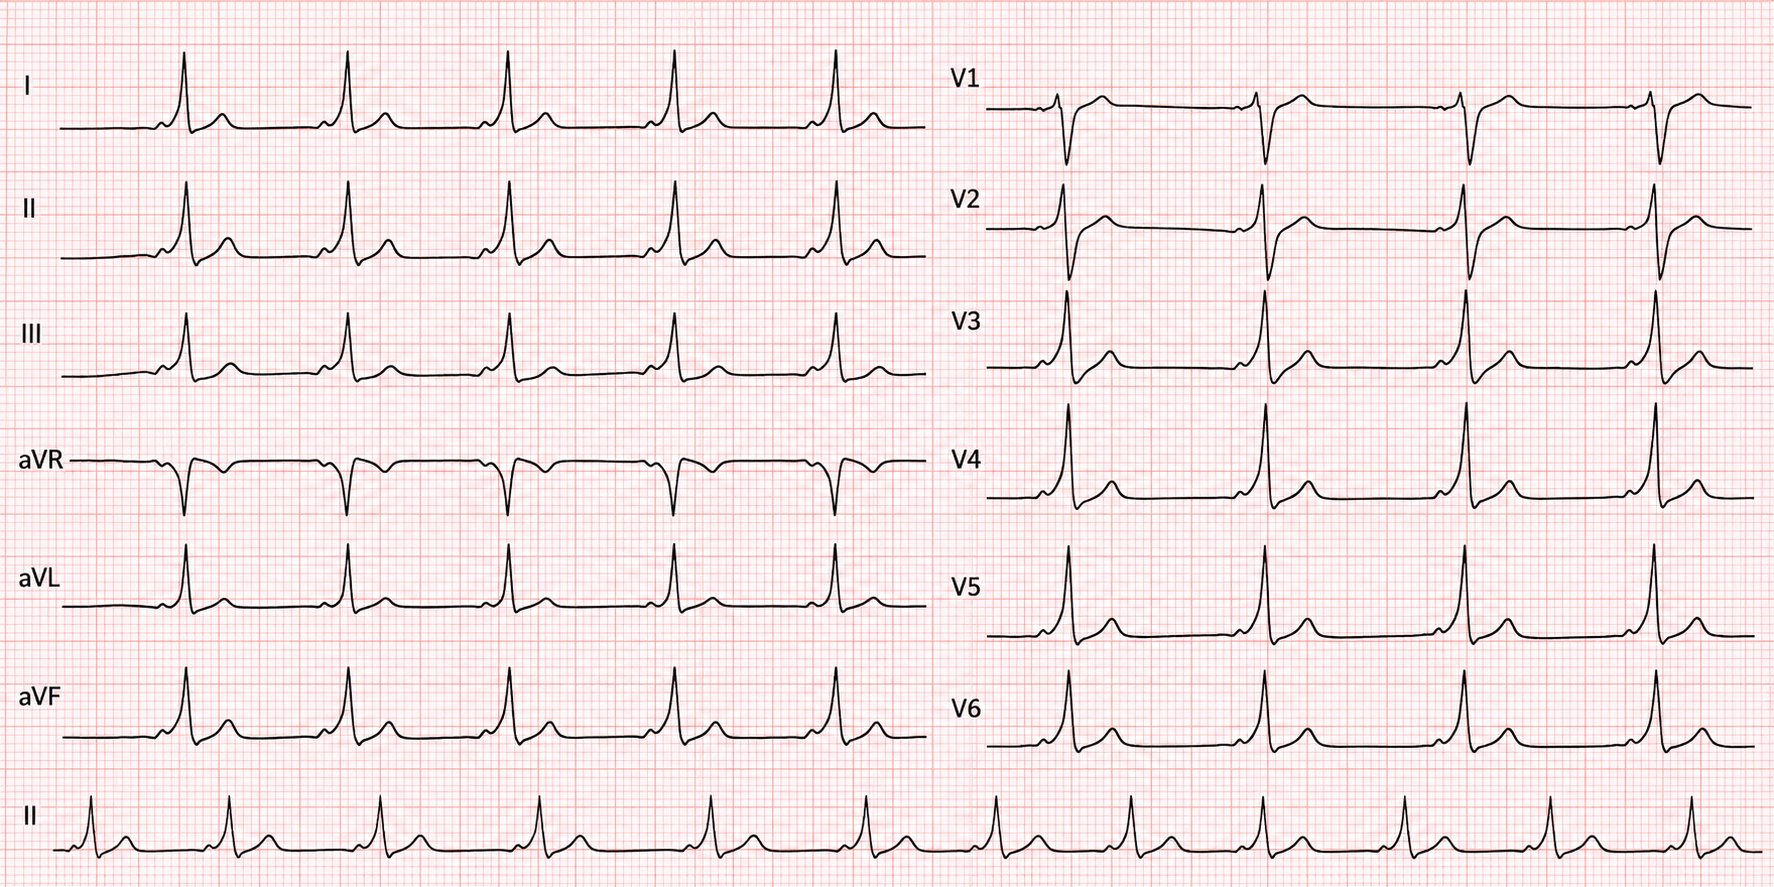
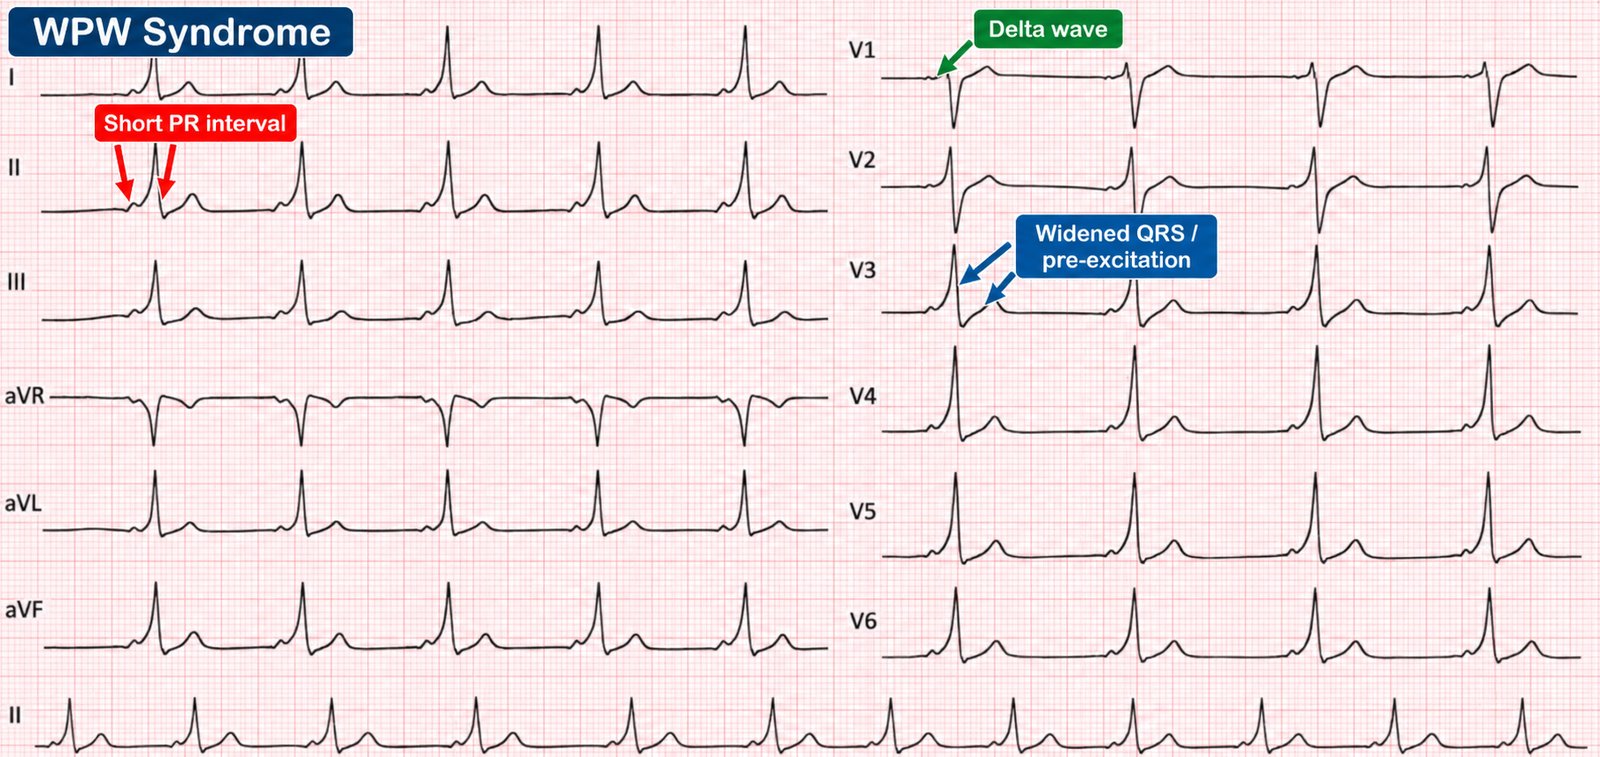
In Wolff–Parkinson–White syndrome an accessory pathway (the bundle of Kent) bypasses the AV node, so part of the ventricle is depolarised early ("pre-excited"). The resting ECG shows a triad:
- Short PR interval (< 120 ms) — the impulse skips the AV nodal delay.
- Delta wave — a slurred upstroke to the QRS from slow initial myocyte-to-myocyte spread.
- Broad QRS — a fusion of pre-excited and normally conducted activation.
The arrhythmias of WPW
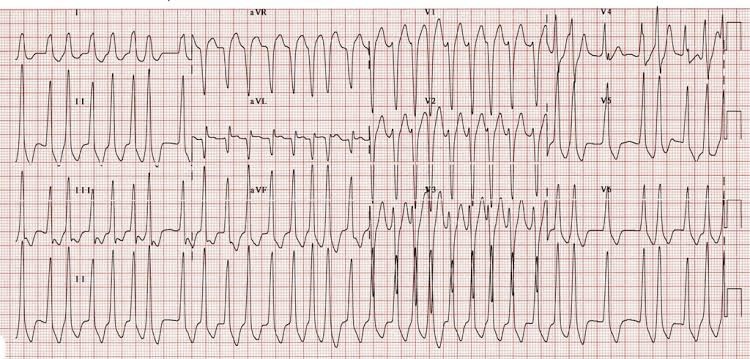
Orthodromic AVRT (common) conducts down the AV node and back up the pathway → a regular narrow-complex SVT. Antidromic AVRT (rare) does the reverse → a regular broad-complex tachycardia that mimics VT.
27 · Long QT & short QT
The QT interval reflects the total duration of ventricular depolarisation and repolarisation. A prolonged QT lengthens the vulnerable period and predisposes to torsades de pointes (Chapter 25).
Measuring & correcting
Measure the QT in the lead where it is longest (often II or V5), from the start of the QRS to the end of the T wave, and correct for rate (QTc). A QTc > 440 ms (men) / 460 ms (women) is prolonged; > 500 ms carries a high torsades risk. The bedside rule of thumb — QT should be less than half the preceding R–R at normal rates — is a quick screen.
Causes of a long QT
| Congenital | Acquired |
|---|---|
| Romano–Ward (autosomal dominant) | Drugs: antiarrhythmics, macrolides, antipsychotics, methadone, some antiemetics/antifungals |
| Jervell–Lange-Nielsen (with deafness) | Electrolytes: ↓K⁺, ↓Mg²⁺, ↓Ca²⁺ |
| Others: hypothermia, bradycardia, raised ICP, hypothyroidism, ischaemia |
Short QT syndrome is a rarer inherited channelopathy (QTc < ~340 ms) also associated with AF and sudden death — worth knowing exists.
28 · Brugada syndrome
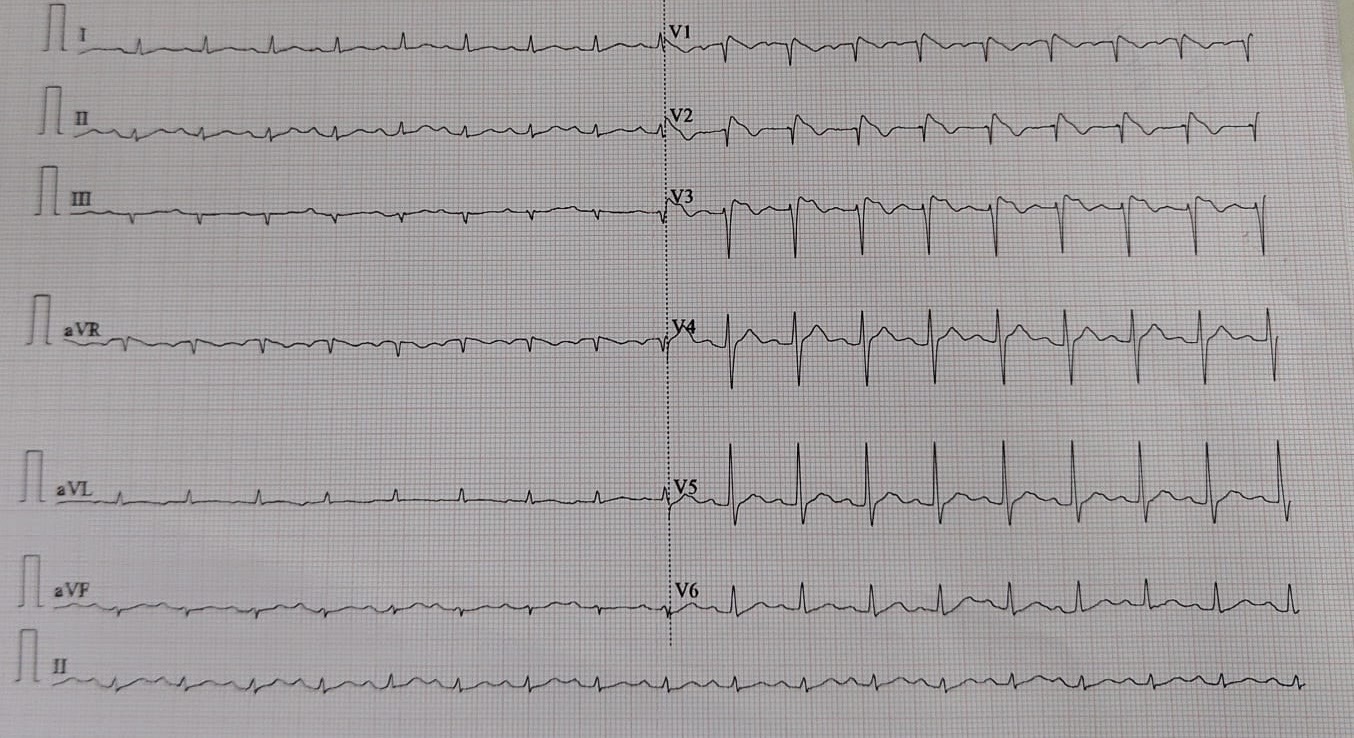
An inherited sodium-channelopathy causing sudden cardiac death in young, structurally normal hearts — often during sleep or fever. The diagnostic ECG pattern sits in the right precordial leads (V1–V2):
- Type 1 (diagnostic): coved ST elevation ≥ 2 mm with a descending ST segment into an inverted T wave.
- Type 2: saddle-back ST elevation — suggestive, not diagnostic.
29 · ARVC & the inherited cardiomyopathies
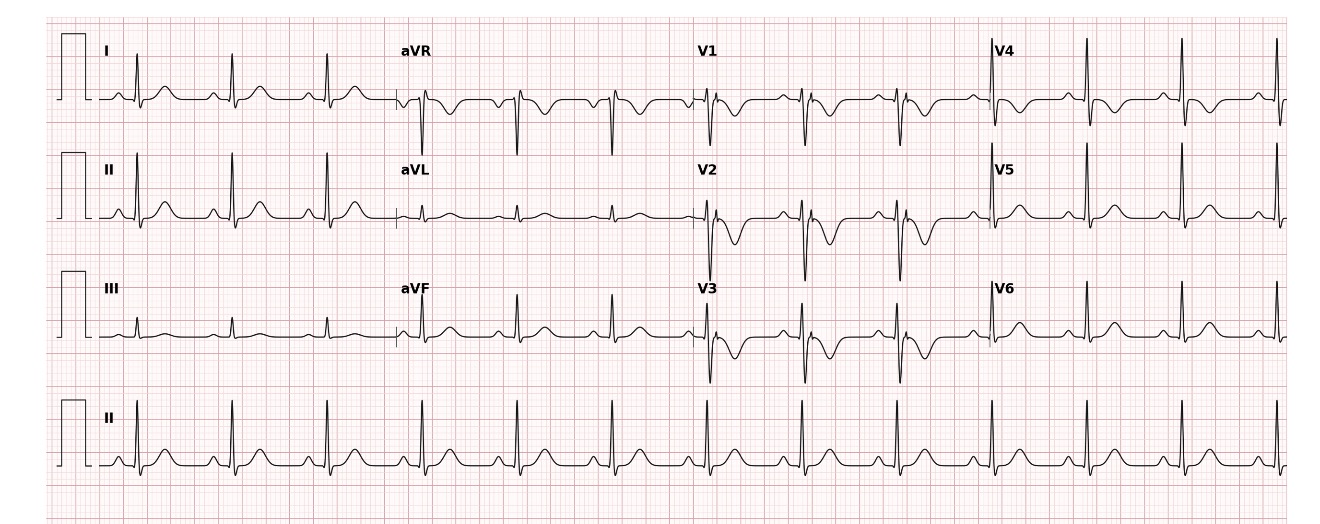
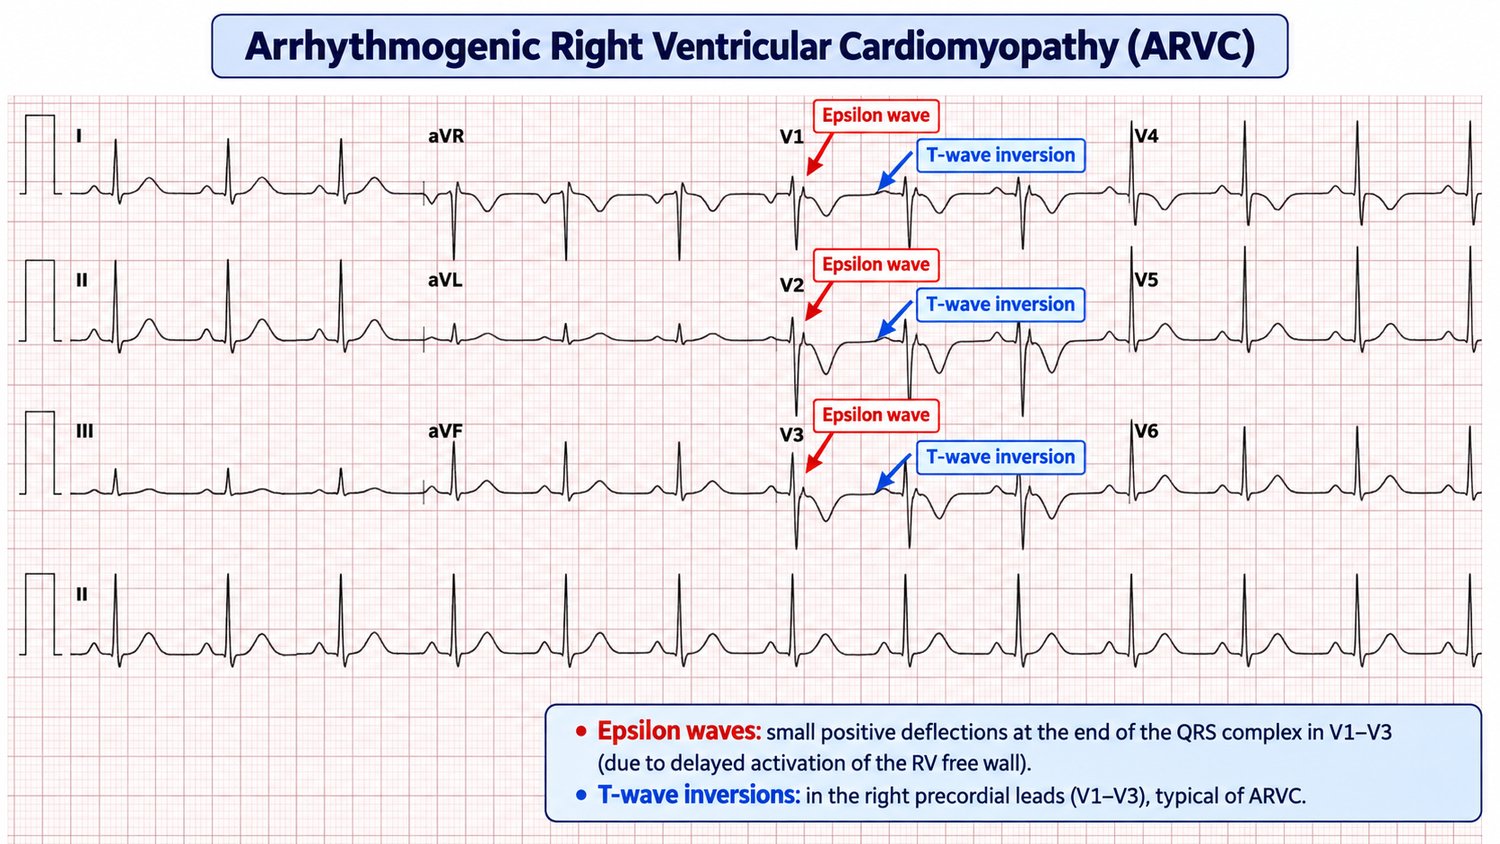
Arrhythmogenic right ventricular cardiomyopathy (ARVC) replaces right ventricular myocardium with fibrofatty tissue, creating a substrate for VT and sudden death in young people and athletes. ECG clues:
- Epsilon wave — a small deflection at the end of the QRS in V1–V2 (delayed RV activation) — the specific sign.
- T-wave inversion in V1–V3 in an adult (beyond the normal juvenile pattern).
- Prolonged S-wave upstroke in V1–V3; VT with a left bundle branch block morphology (because it arises from the right ventricle).
HCM (Chapter 9) is the other inherited cardiomyopathy to keep in mind in the young patient with syncope — high voltages, deep septal Q waves and repolarisation change. Together, HCM, ARVC, WPW and the channelopathies (long QT, Brugada) make up the "sudden death in the young" ECGs that must never be dismissed as normal.
↑ ContentsPart VI · Electrolytes, drugs & the environment
The ECG is a real-time biochemistry and toxicology monitor. Potassium, calcium and magnesium reshape the waveform; specific drugs leave fingerprints; and the environment — cold especially — writes its own signs. These are patterns that let you make a diagnosis before the blood results return.
30 · Potassium — hyper- & hypokalaemia
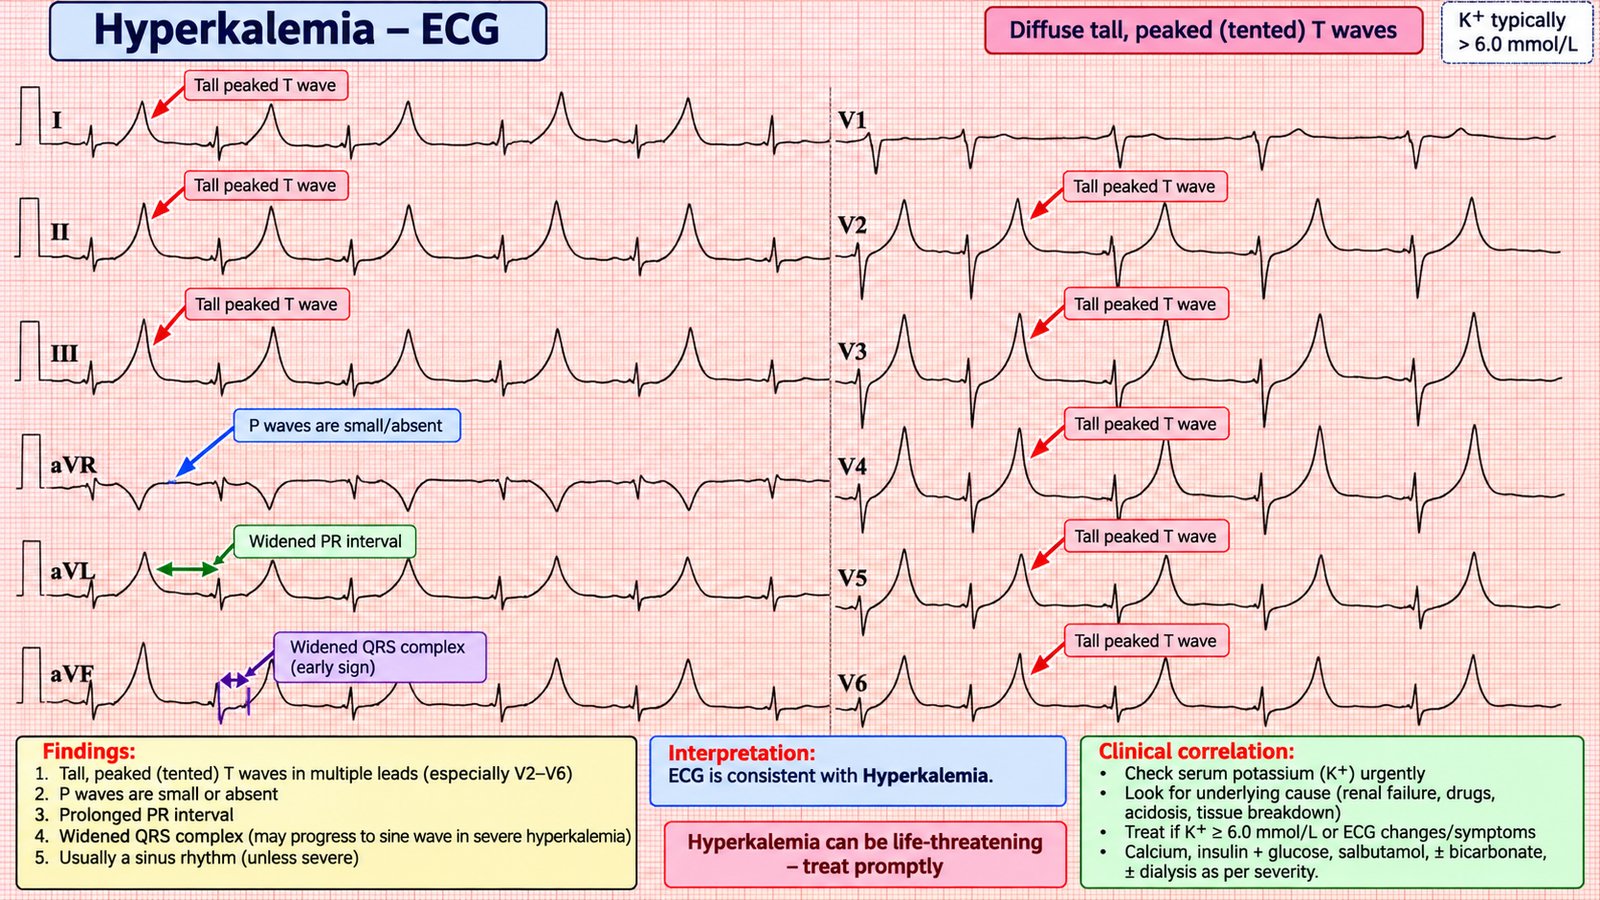
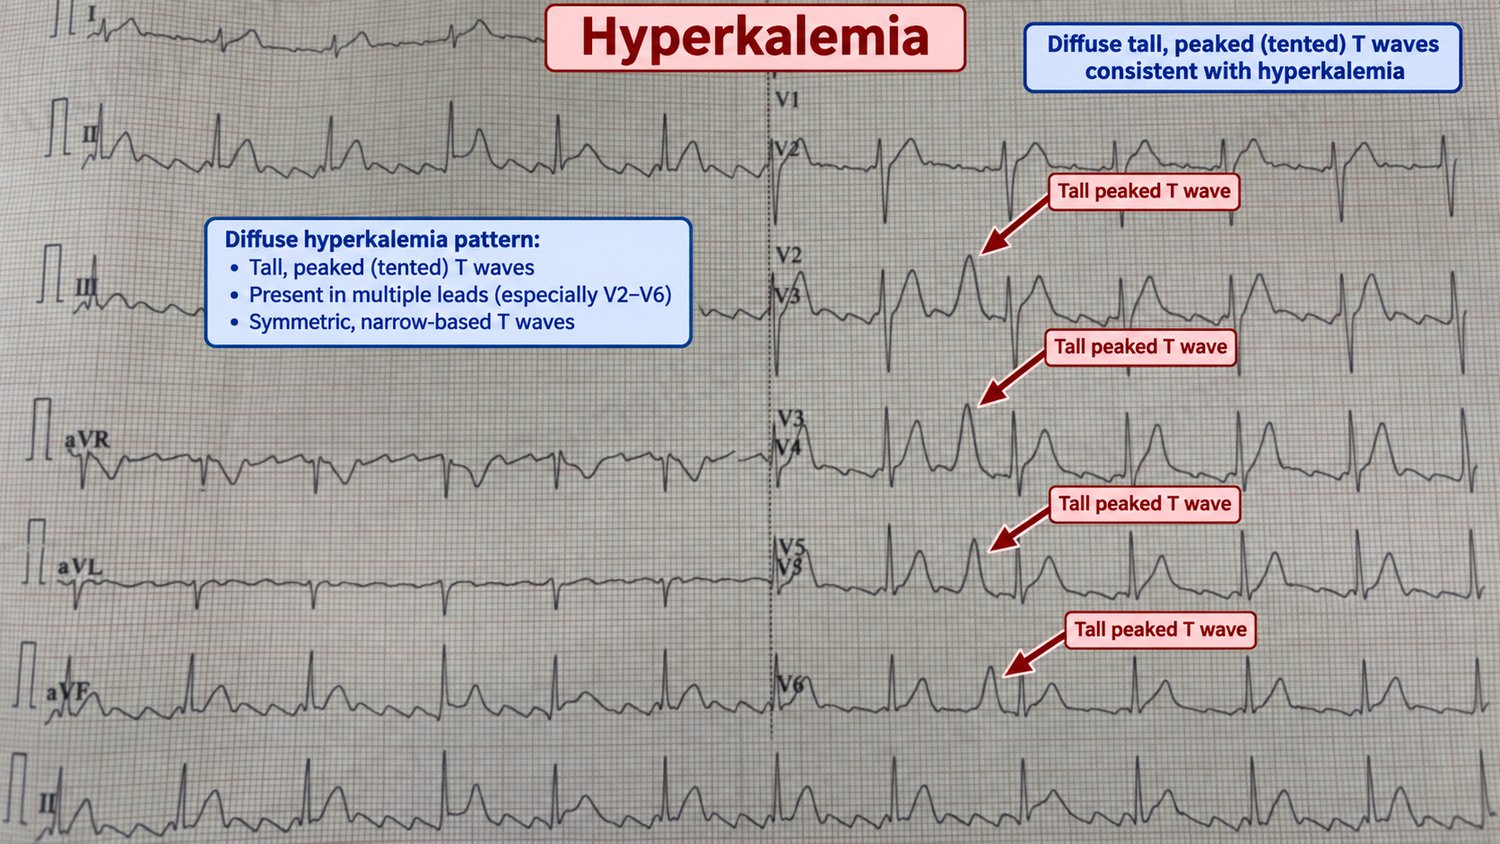
Hyperkalaemia — a progressive, life-threatening sequence
As serum potassium rises, the ECG changes in a fairly predictable order. Recognising it early — before the terminal rhythms — is life-saving because the ECG can move faster than the lab.
- Tall, peaked ("tented") T waves — the earliest sign, best in the precordial leads.
- P-wave flattening then loss, with PR prolongation.
- QRS widening — the complexes broaden and slur.
- Sine-wave pattern — QRS and T merge into a sinusoid — pre-terminal.
- Ventricular fibrillation or asystole.
Hypokalaemia
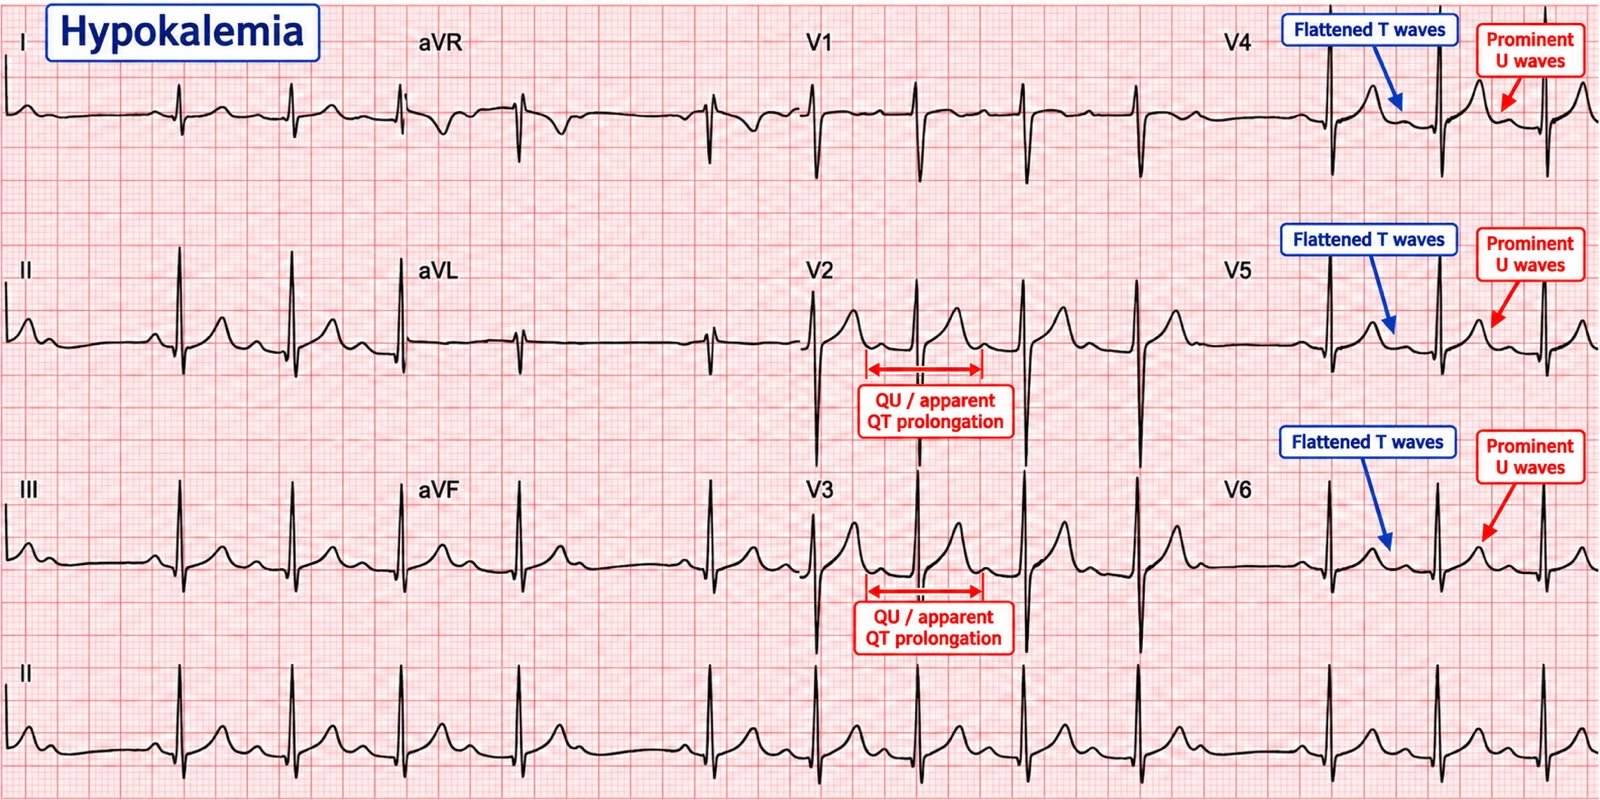
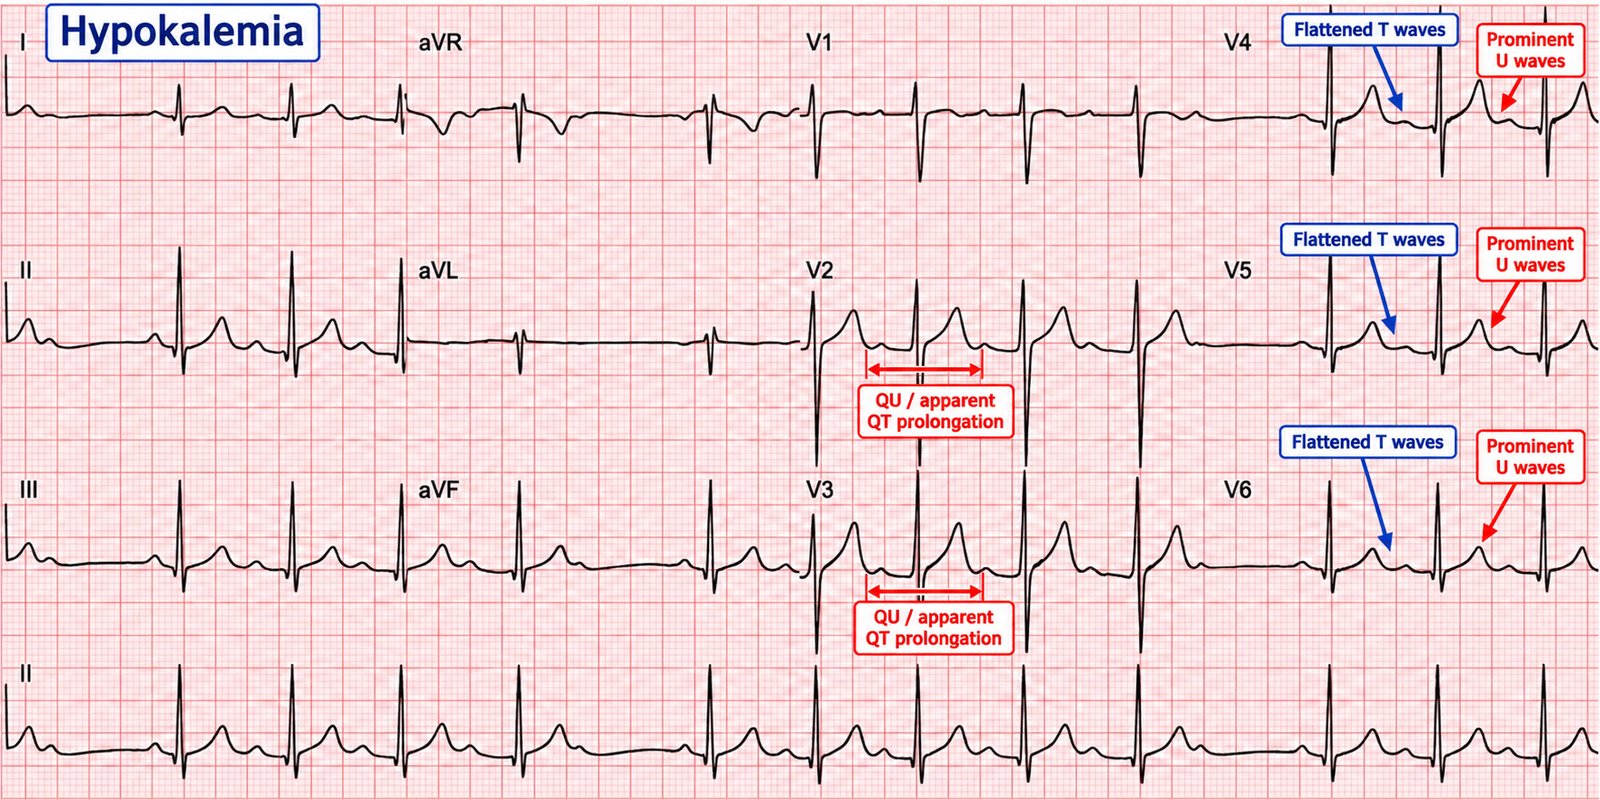
Low potassium does the opposite to repolarisation: T-wave flattening, ST depression, and prominent U waves (a positive deflection after the T). As it worsens, the T and U fuse, the QT (really QU) lengthens, and the risk of torsades and other ventricular arrhythmias rises.
31 · Calcium, magnesium & the QT
Calcium mainly alters the ST segment and hence the QT:
- Hypocalcaemia → prolonged ST segment → long QT (with torsades risk).
- Hypercalcaemia → short ST segment → short QT; severe cases show a J wave (Osborn-like) and arrhythmia.
Magnesium disturbances rarely produce a single signature pattern, but hypomagnesaemia potentiates hypokalaemia and long-QT arrhythmias, which is why magnesium is given in torsades regardless of the level. Hypermagnesaemia (e.g. in eclampsia treatment or renal failure) can cause bradycardia, PR/QRS prolongation and, at extremes, complete heart block and arrest.
32 · Digoxin — effect vs toxicity
Two quite different things share the name "digoxin on the ECG."
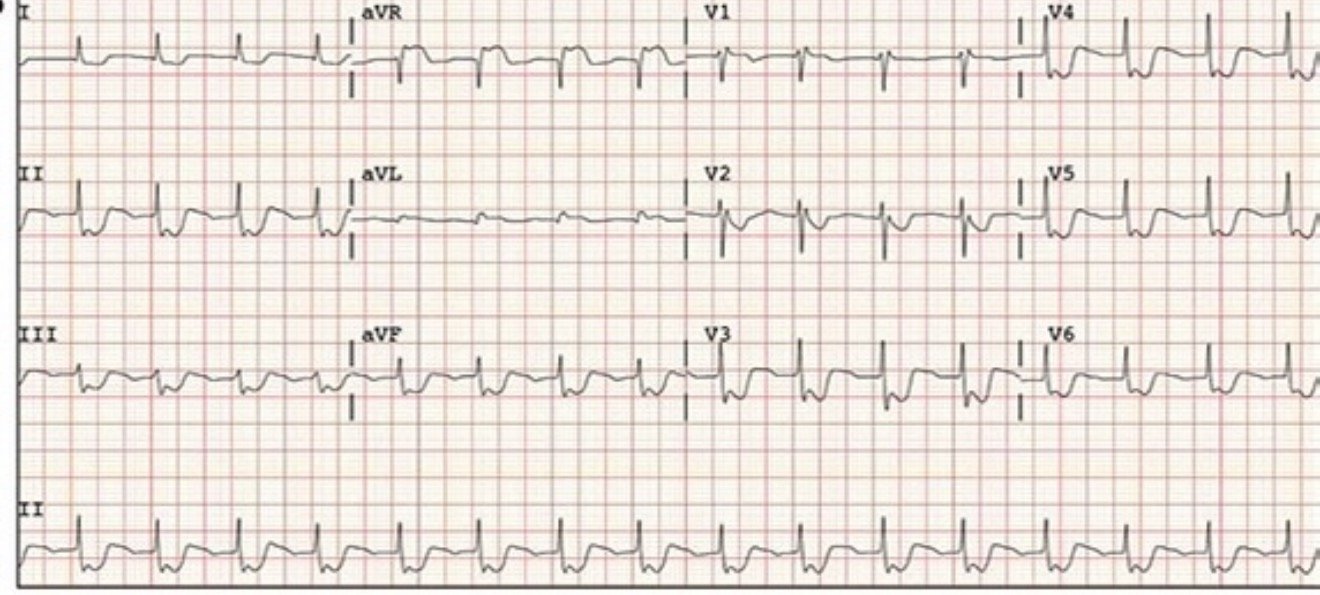
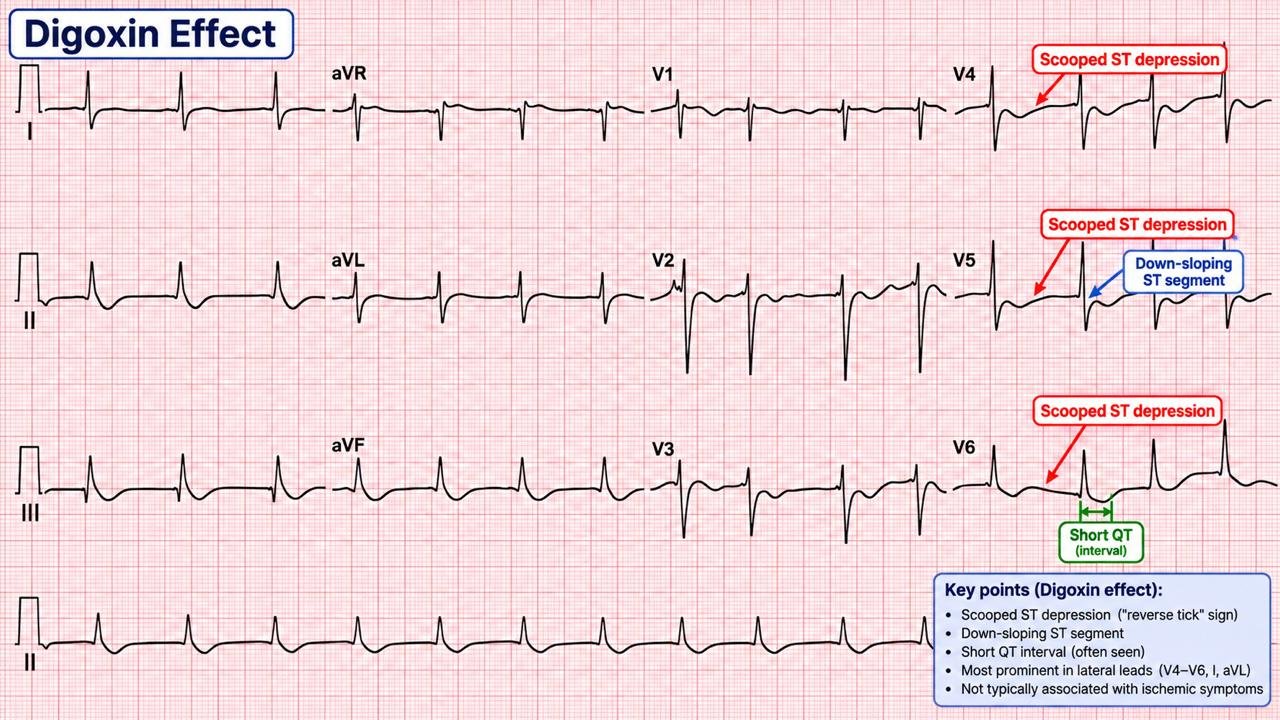
Digoxin effect (therapeutic)
Seen at therapeutic levels and not a sign of toxicity: down-sloping "reverse-tick" ST depression, T-wave flattening/inversion, a short QT, and increased U-wave amplitude — most visible in the lateral leads.
Digoxin toxicity
Toxicity is an electrophysiological diagnosis: increased automaticity plus depressed conduction. The classic combination is a supraventricular tachyarrhythmia (e.g. atrial tachycardia) with AV block. Almost any arrhythmia can occur; the near-pathognomonic ones are bidirectional VT (Chapter 25) and "regularised" (slow, regular) AF from complete heart block superimposed on AF.
33 · Sodium-channel blockade & TCA overdose
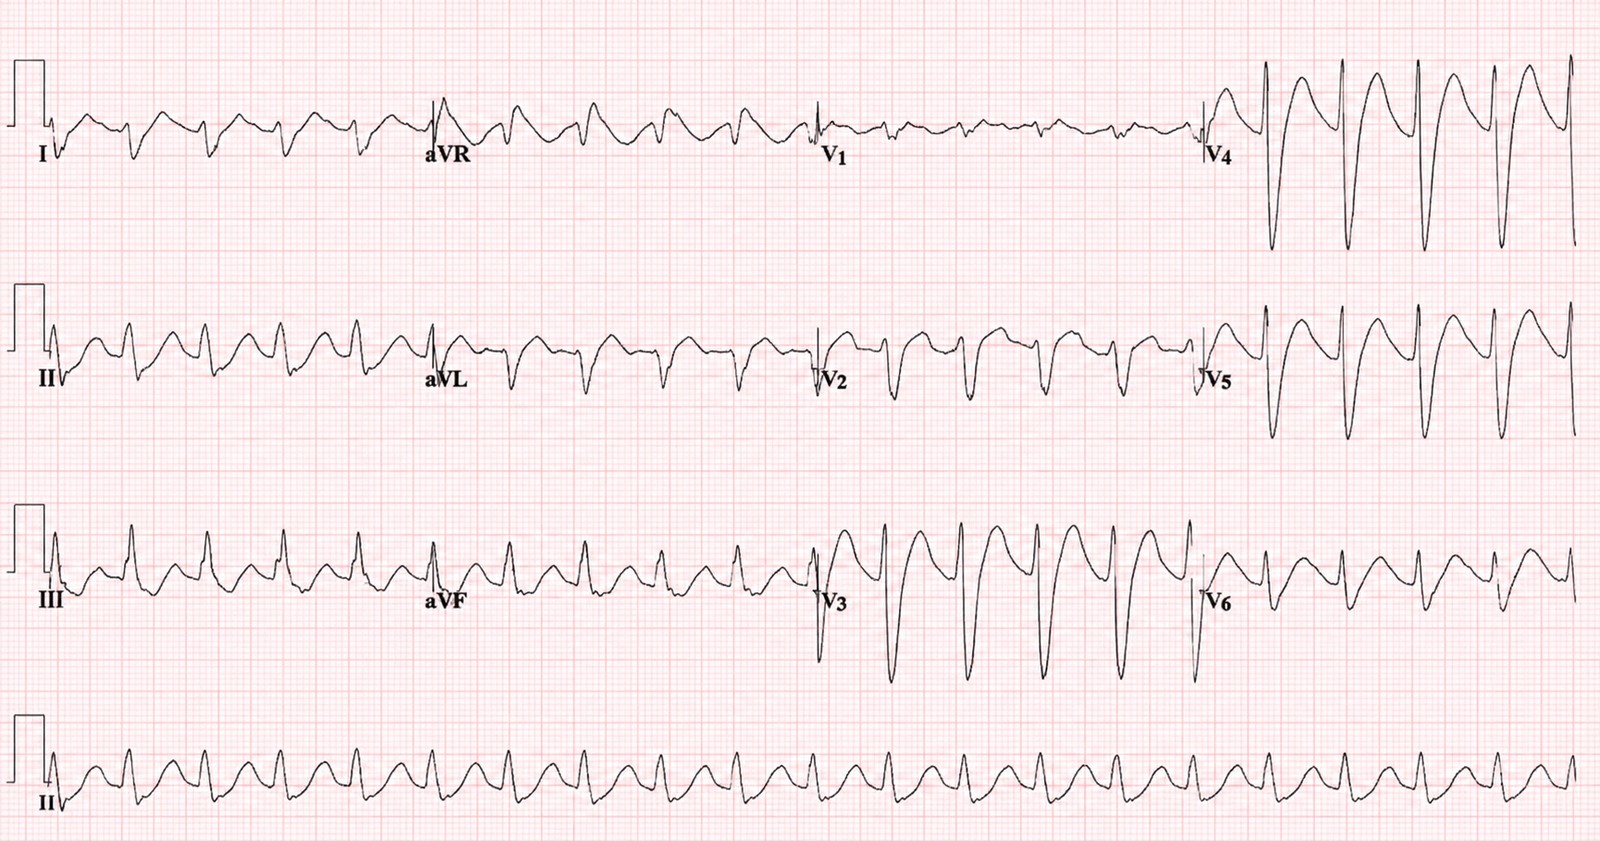
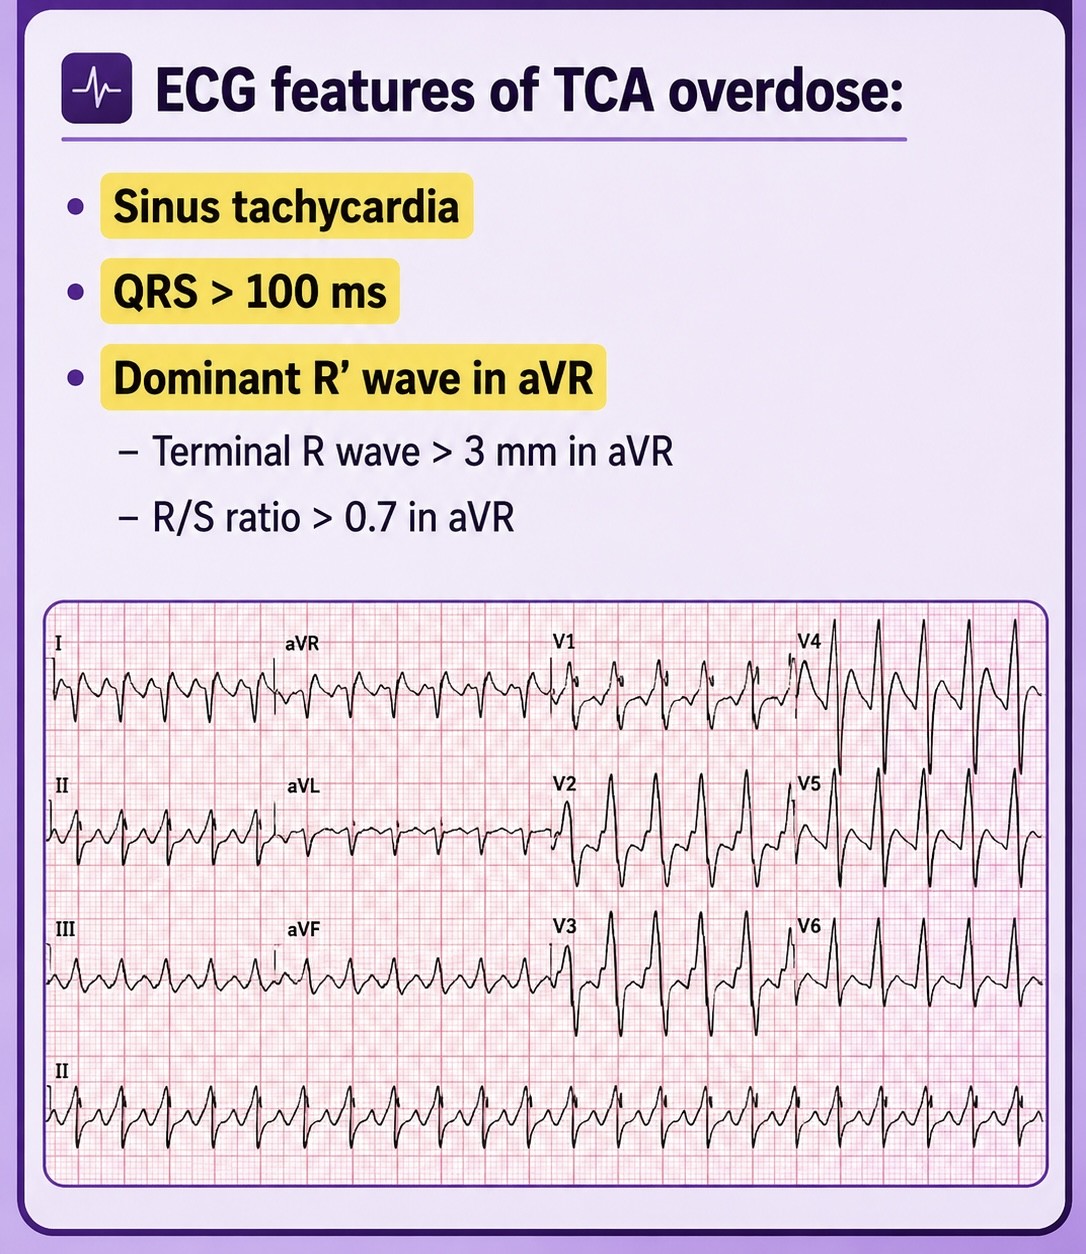
Tricyclic antidepressants — and other sodium-channel-blocking drugs — produce a recognisable and dangerous ECG in overdose. The blockade slows cardiac depolarisation and unmasks a rightward terminal vector:
- Broad QRS (> 100 ms) — the key marker of cardiotoxicity and seizure risk.
- Terminal R wave in aVR (≥ 3 mm) and a deep S wave in I/aVL — the rightward terminal axis.
- Sinus tachycardia (anticholinergic), prolonged QT, and, as toxicity worsens, VT/VF.
34 · Hypothermia & the Osborn wave
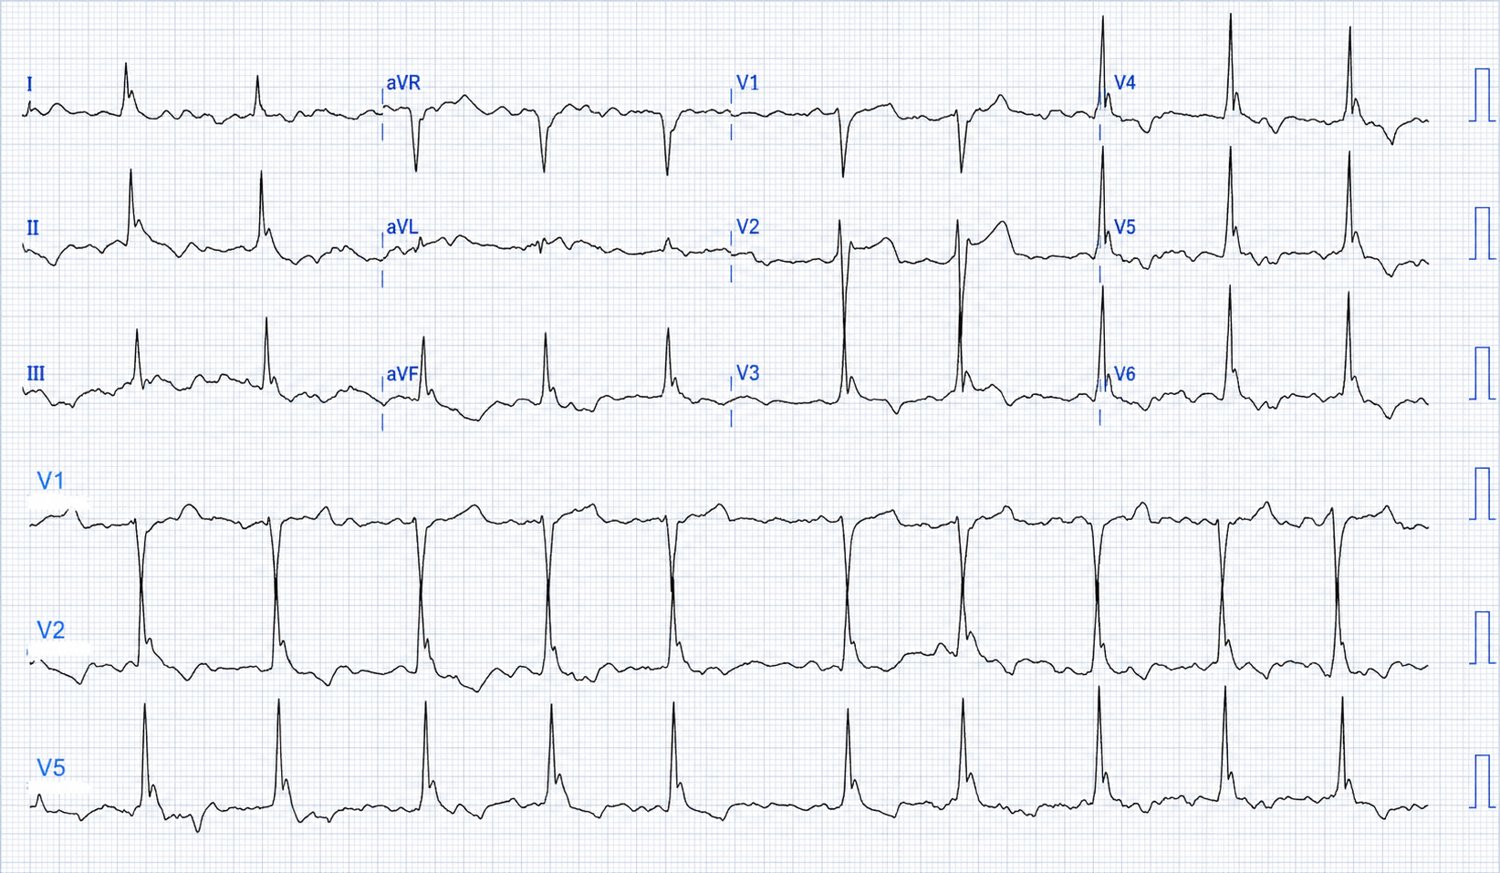
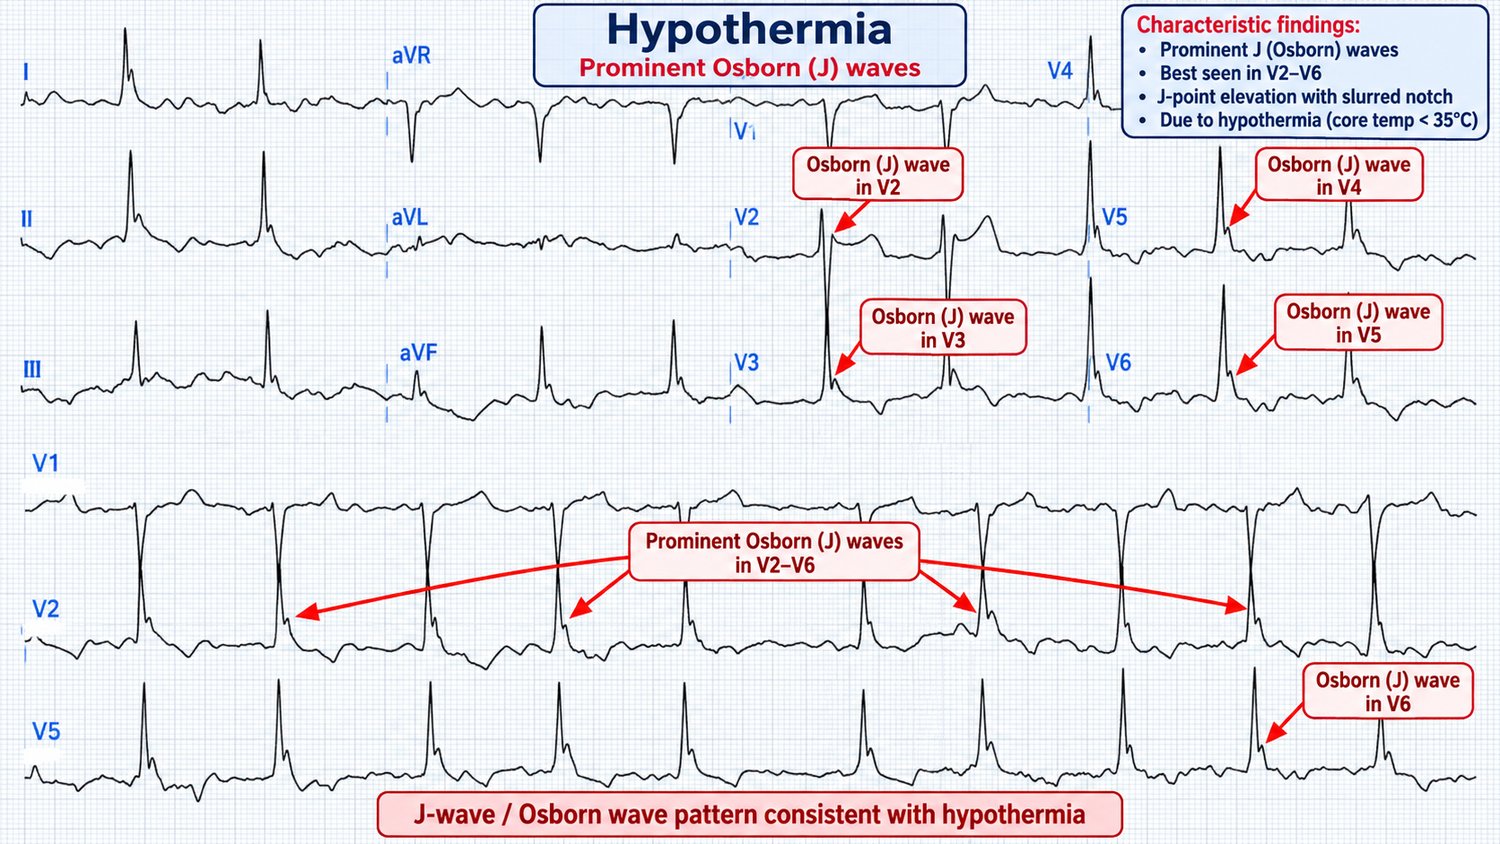
Core hypothermia produces a distinctive set of changes: bradycardia, prolongation of all intervals (PR, QRS, QT), shivering artefact, a tendency to AF and other arrhythmias, and the characteristic Osborn (J) wave — a positive deflection at the QRS–ST junction (the J point), most prominent in the inferior and lateral leads and taller the colder the patient.
35 · The ECG in pulmonary embolism
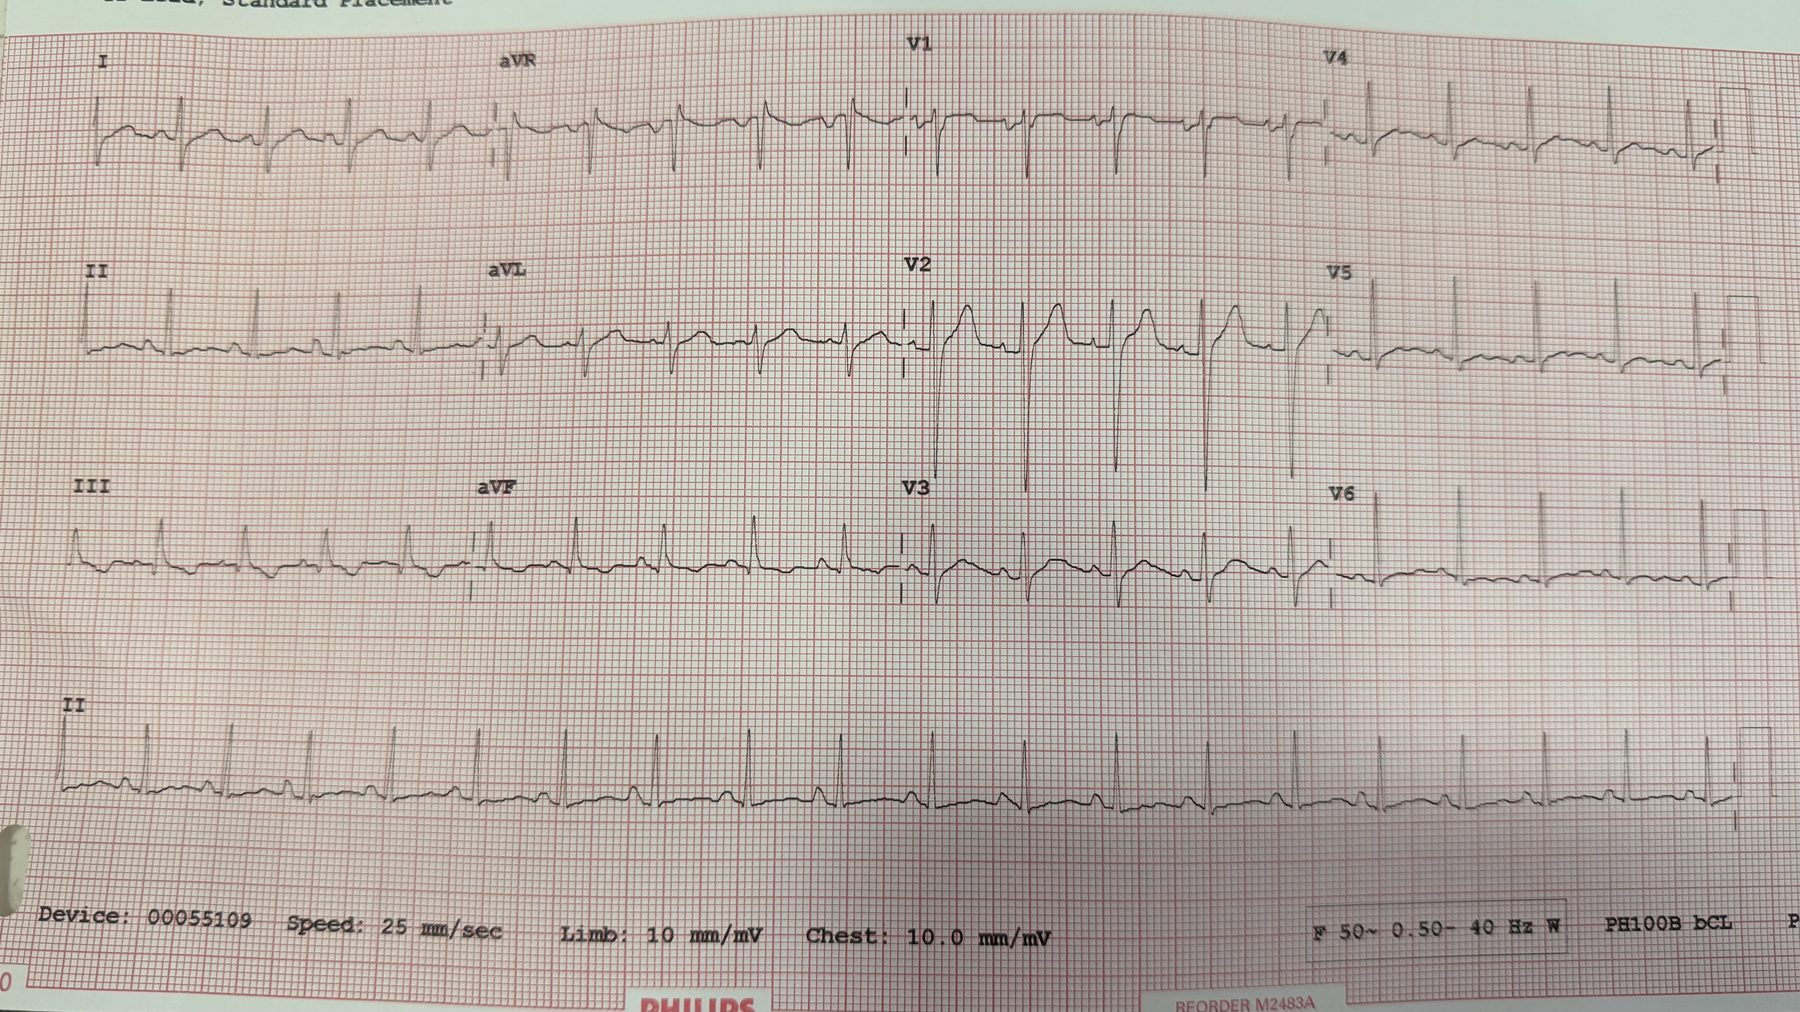
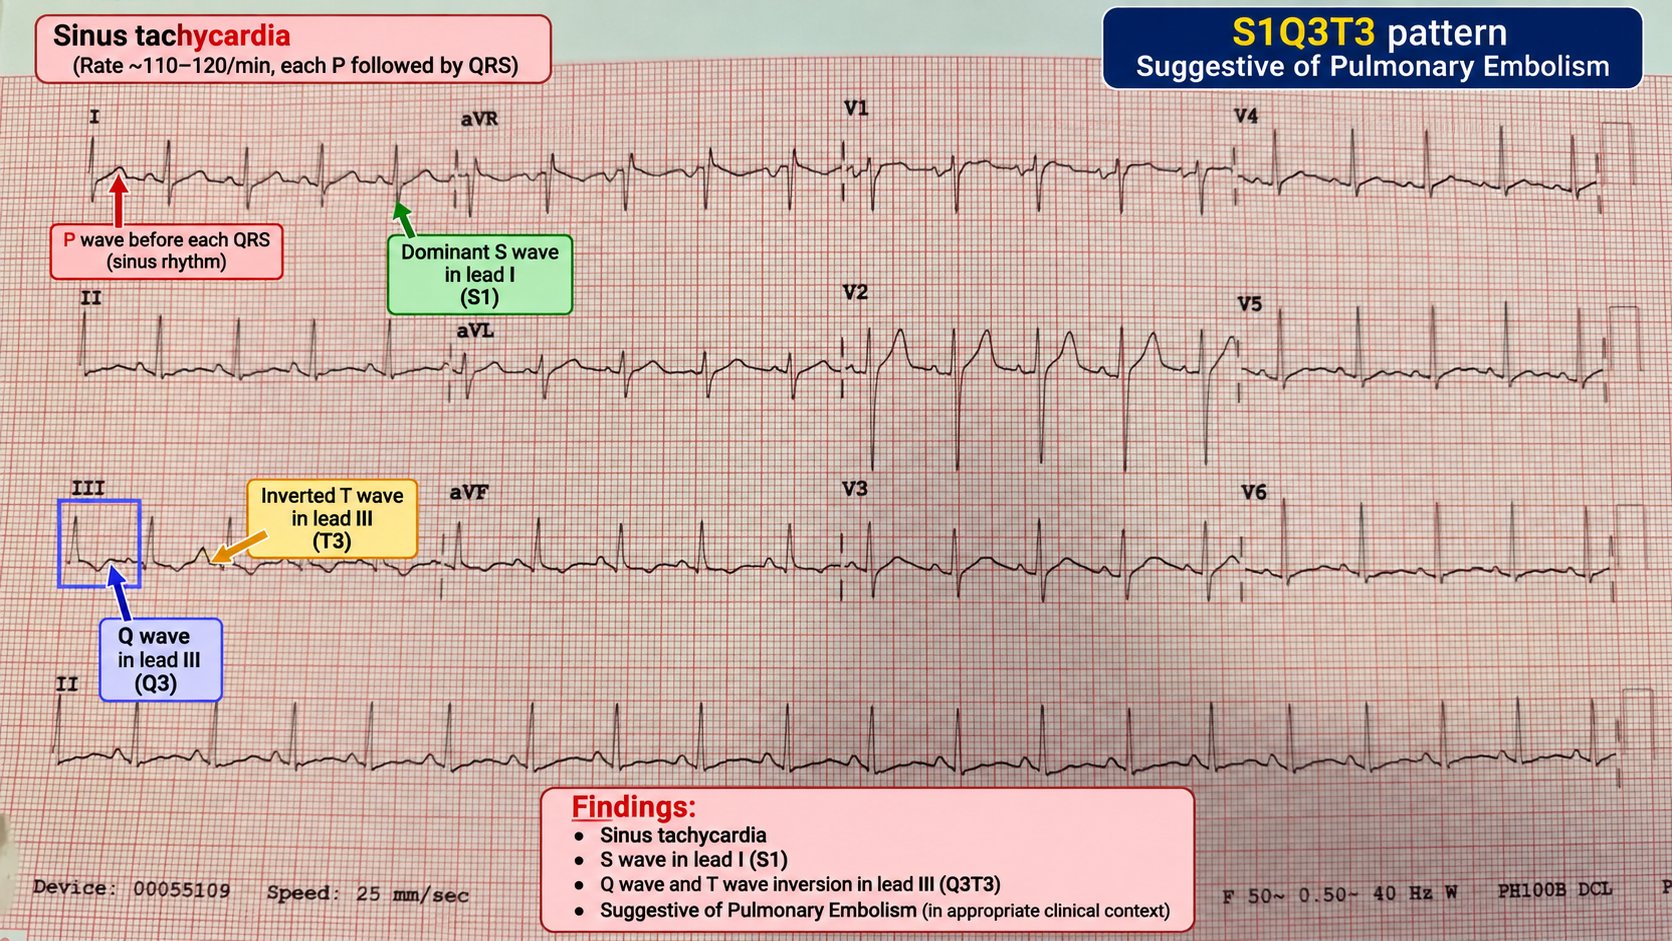
There is no single "PE ECG," and the commonest finding is simply sinus tachycardia. But a cluster of signs reflects acute right-heart strain and, in the right clinical context, raises the suspicion considerably:
- S1Q3T3 — an S wave in I, a Q wave and inverted T in III. Classic but insensitive and non-specific.
- T-wave inversion in the right precordial leads (V1–V4) — a marker of RV strain, and one of the more useful signs.
- New right bundle branch block (complete or incomplete), right axis deviation, and P pulmonale.
- AF or other atrial arrhythmia.
Part VII · Special situations & putting it together
The last part collects the tracings that fall outside the neat categories — paced rhythms, artefact and technical traps, and the paediatric ECG — and ends with a one-page method to carry into every shift.
36 · Pacemakers on the ECG
A paced ECG shows pacing spikes — sharp, narrow vertical deflections — before the chamber they capture.
- Atrial pacing: spike before a P wave.
- Ventricular pacing: spike before a broad, LBBB-morphology QRS (the RV apex is paced, so the left ventricle activates late).
- Dual-chamber pacing: two spikes — one before the P, one before the QRS.
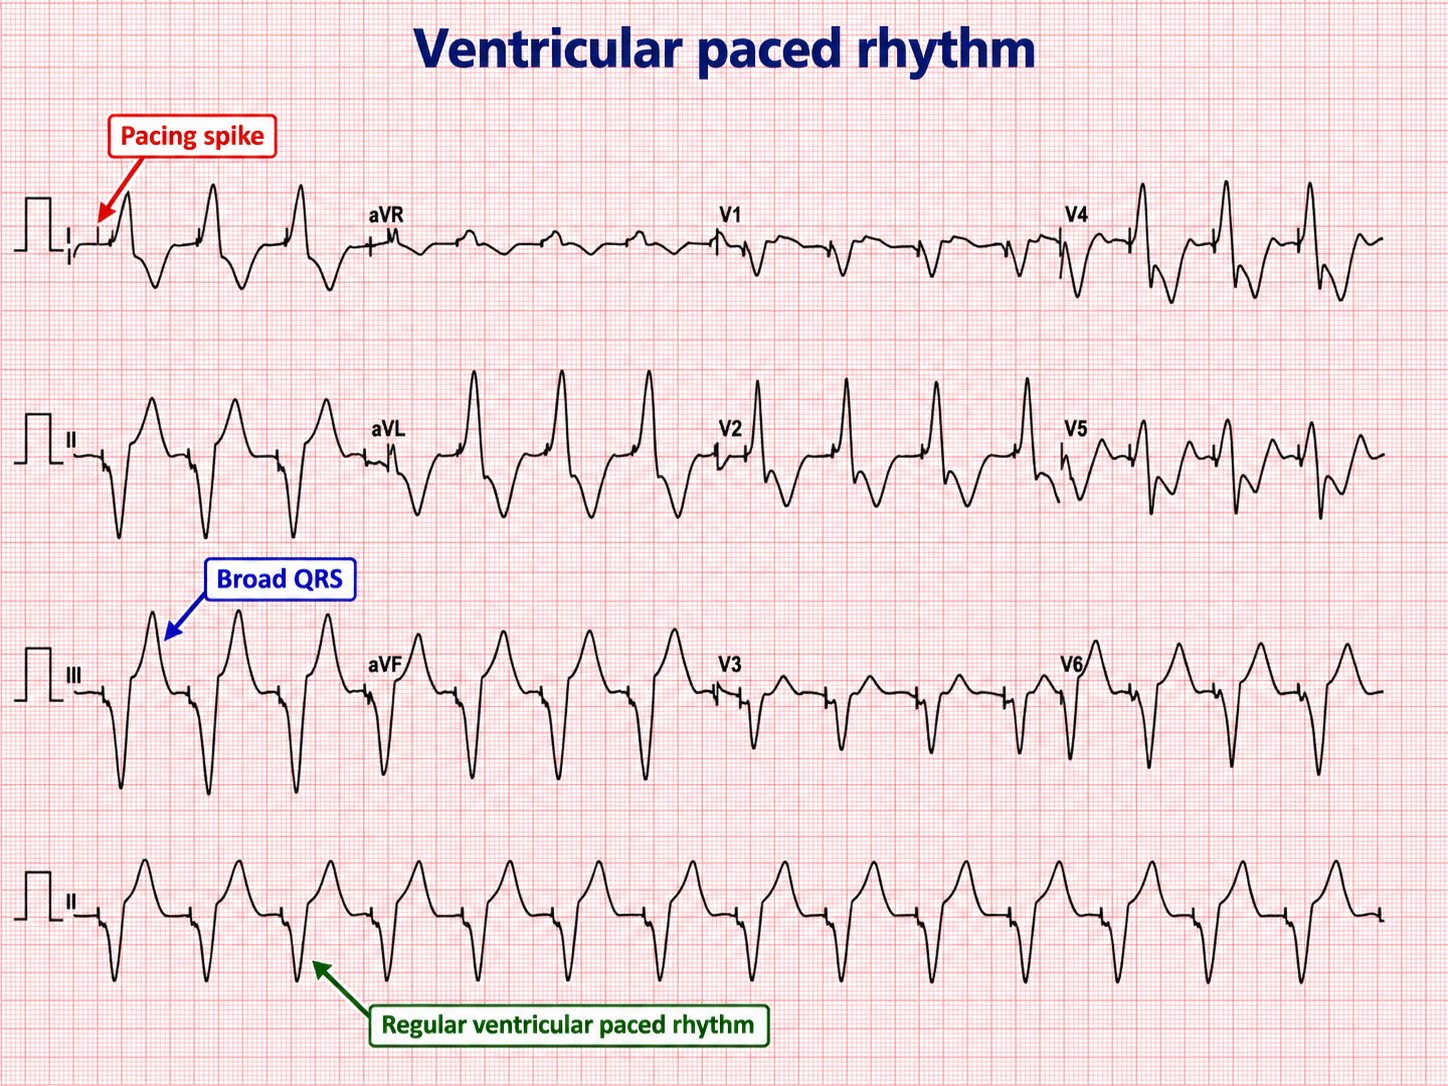
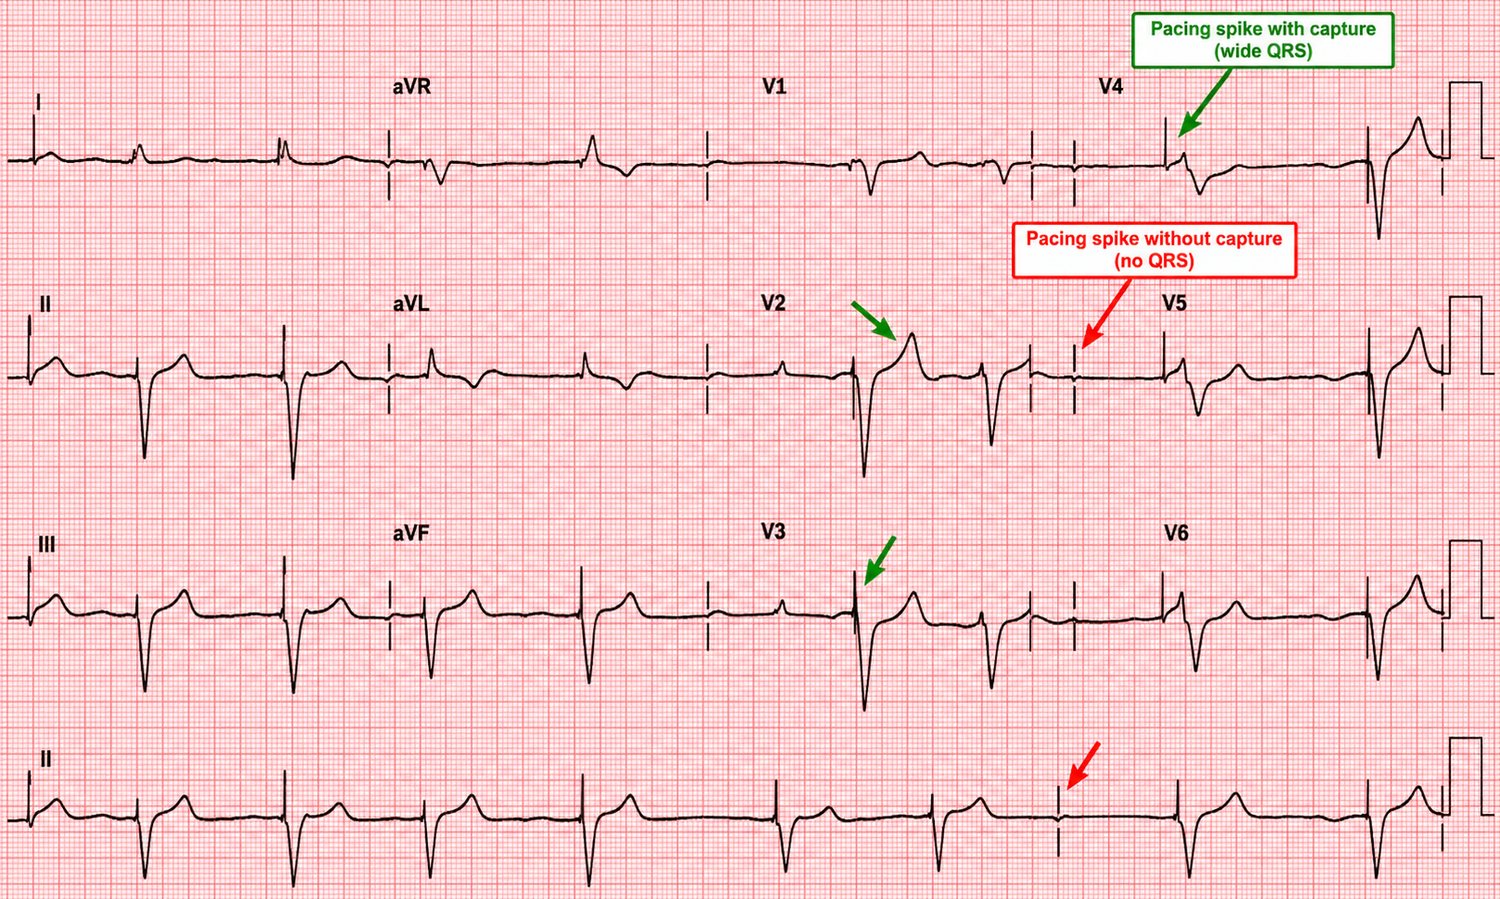
Pacemaker malfunction
- Failure to capture: a spike not followed by a complex.
- Failure to sense: spikes firing inappropriately, ignoring the patient's own beats (risking R-on-T).
- Failure to pace/output: no spikes when they are due.
37 · Technical pitfalls, artefact & dextrocardia
Some "abnormal" ECGs are the machine's fault, not the heart's. Recognising these prevents dangerous over-treatment.
Lead misplacement & dextrocardia
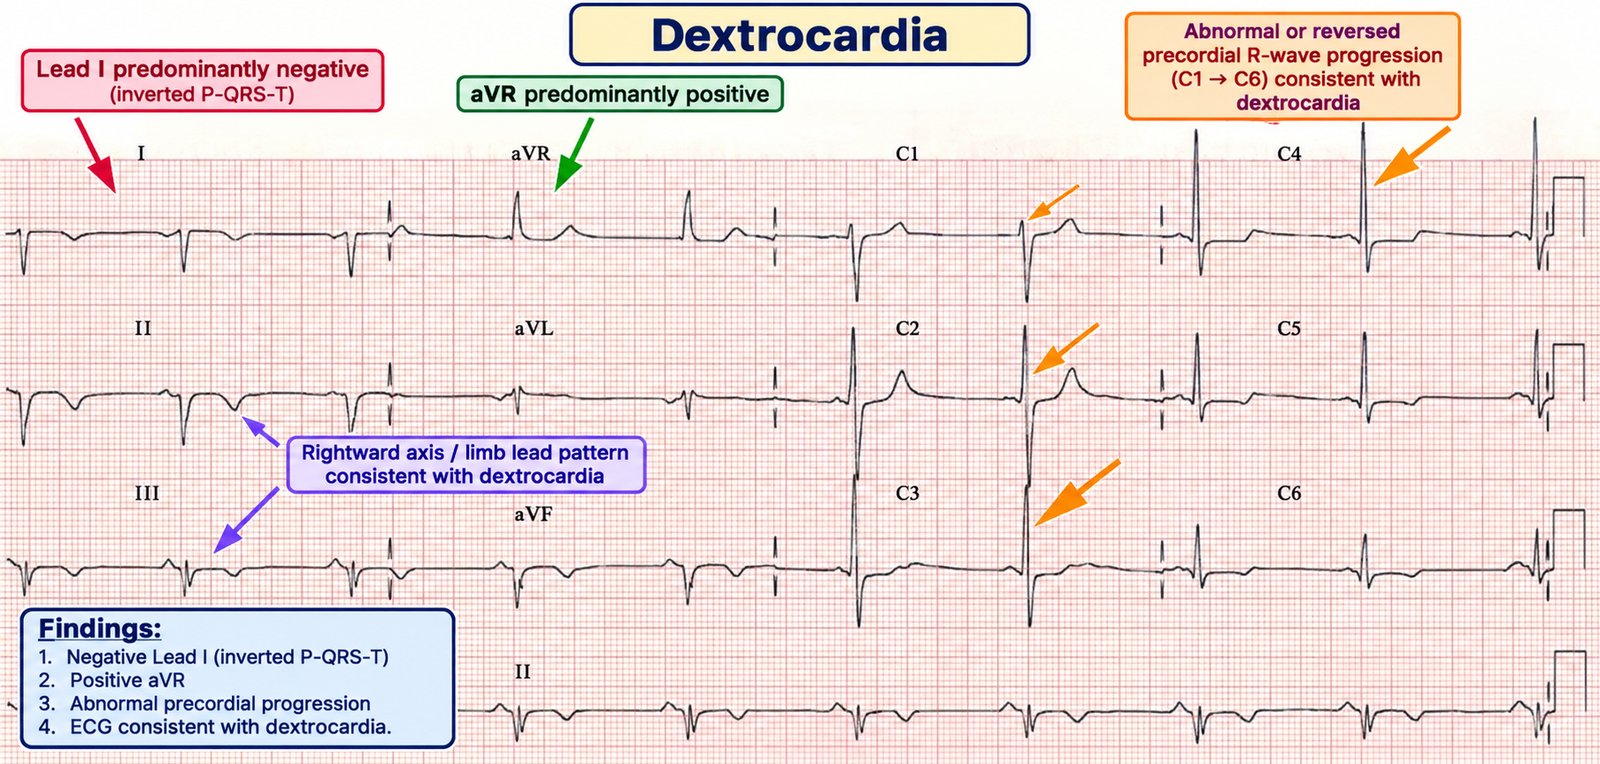
Limb-lead reversal (classically left/right arm) produces an inverted P–QRS–T in lead I and an abnormal axis with an otherwise normal precordium. True dextrocardia gives a similar limb-lead picture plus reversed R-wave progression (the R waves get smaller across V1→V6). The distinction: in dextrocardia, right-sided chest leads normalise the precordial pattern; in arm-lead reversal they do not.
Poor R-wave progression & electrical alternans
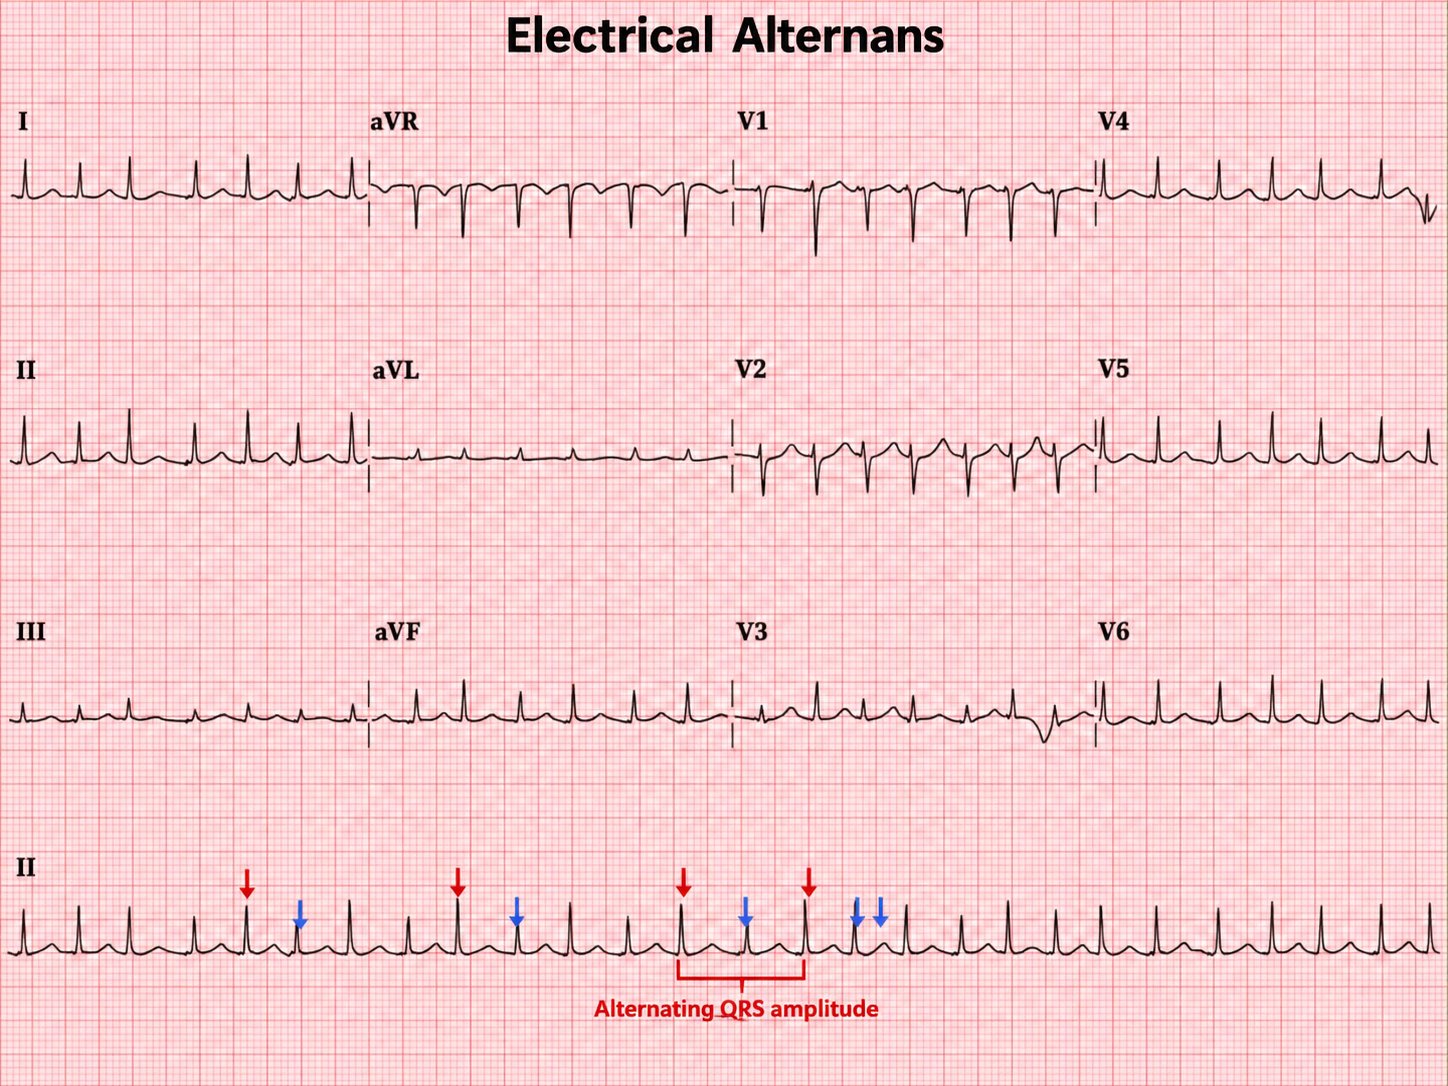
Poor R-wave progression (R waves fail to grow across the precordium) may mean old anterior MI, LVH, lead misplacement or a large body habitus. Electrical alternans — beat-to-beat variation in QRS amplitude — with sinus tachycardia and low voltages suggests a large pericardial effusion / tamponade (the heart swinging in fluid).
Artefact
Shivering, tremor (e.g. Parkinson's), movement and electrical interference can mimic arrhythmia — most dangerously mimicking VT or VF. Before treating a "malignant arrhythmia," look at the patient: an alert, comfortable patient with a "VT" on the monitor almost certainly has artefact. Look for normal QRS complexes marching through the artefact at the true rate.
38 · The paediatric ECG
The child's ECG is not a small adult's. The right ventricle is relatively dominant at birth and regresses with age, so "normal" changes with time. Read paediatric ECGs against age-specific reference ranges.
Normal age-related features
- Faster heart rates and shorter PR/QRS/QT intervals than adults; rates fall steadily with age.
- Right-axis deviation and dominant R in V1 are normal in the neonate/infant (RV dominance), regressing over the first years of life.
- T-wave inversion in V1–V3 (the "juvenile T-wave pattern") is normal in children and can persist into early adulthood — do not mistake it for ischaemia or ARVC.
What to look for
- SVT is the commonest significant paediatric arrhythmia — very fast (often > 220 in infants), narrow and regular; treat with vagal manoeuvres/adenosine as in adults (weight-based dosing).
- Long QT and WPW present in childhood and cause syncope/sudden death — measure the QT and look for a delta wave in any child with syncope or a family history.
- Congenital heart disease patterns: chamber enlargement, conduction abnormalities and specific post-operative changes.
39 · Rapid reference & interpretation checklist
One page to run through every ECG. If you do nothing else, do this in this order, every time.
2 Rate — 300-rule (regular) or 6-second-rule (irregular); atrial vs ventricular.
3 Rhythm — regular/irregular; P before every QRS; sinus?
4 Axis — leads I and aVF.
5 P waves — peaked (right) / broad (left) / absent.
6 PR — long (block) / short + delta (WPW) / depressed (pericarditis).
7 QRS — width, voltages (LVH/RVH), Q waves, R-wave progression, BBB shape.
8 ST — elevation/depression, shape, territory, reciprocal change.
9 T waves — peaked / inverted / flattened.
10 QT — corrected; < half the R–R?
11 Synthesis — one clinical statement, in context, compared with old.
The "never-miss" list
| Pattern | Don't call it… | Because it is… |
|---|---|---|
| V1–V3 ST depression + tall R | "anterior ischaemia" | Posterior STEMI |
| Upsloping ST depression → tall T, V1–V6 | "non-specific" | de Winter / LAD occlusion |
| Deep symmetric TWI V2–V3, pain-free | "resolved" | Wellens / critical LAD |
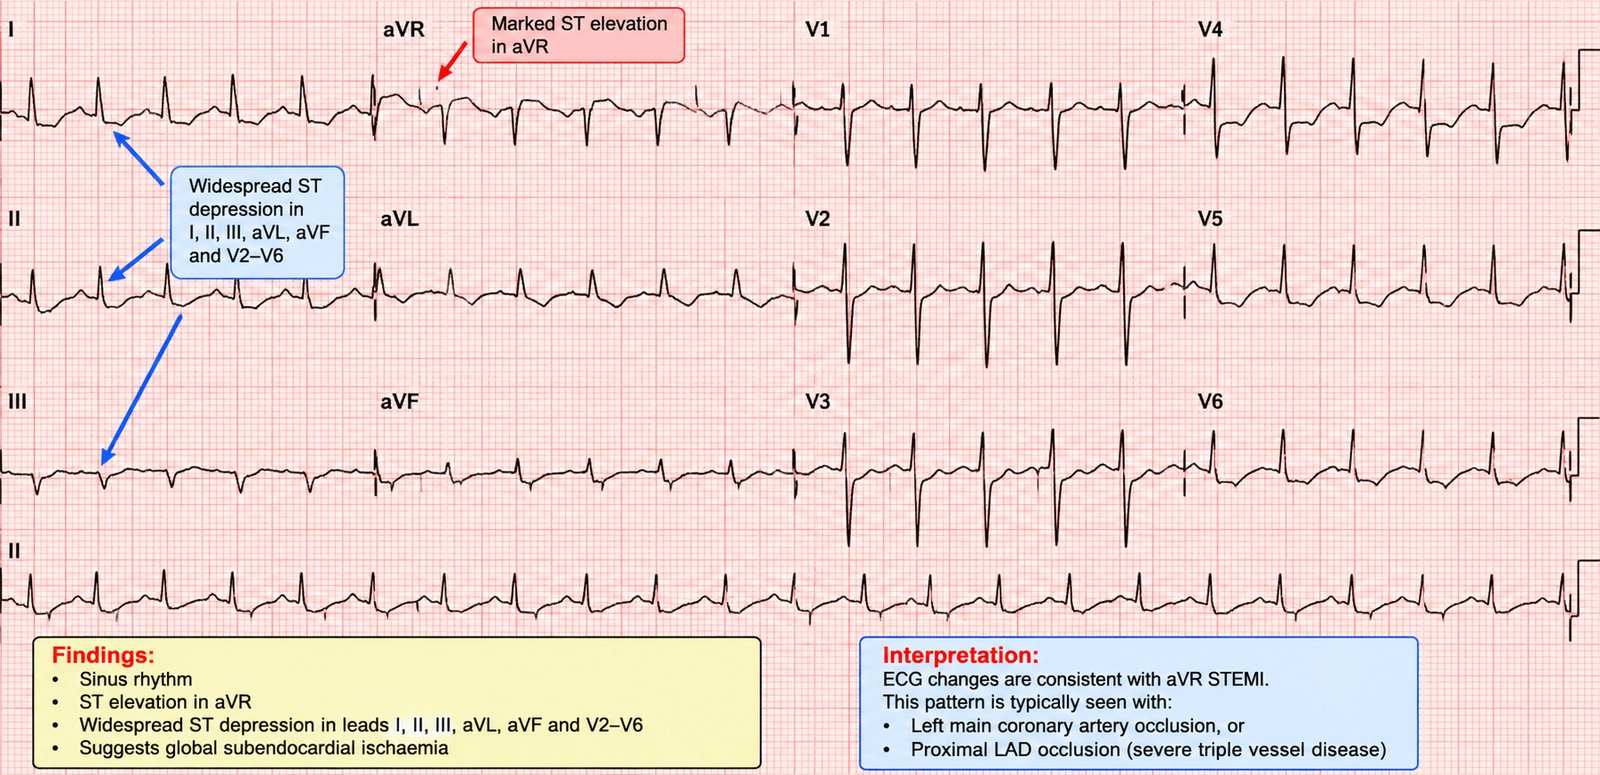
| ST elevation aVR + diffuse depression | "unremarkable aVR" | Left main / 3-vessel |
| Irregular, broad, very fast | "fast AF — give a blocker" | AF in WPW — cardiovert |
| Broad regular tachycardia | "SVT with aberrancy" | VT until proven otherwise |
| Peaked T waves | "benign" | Hyperkalaemia |
| Coved ST elevation V1–V2 | "septal STEMI" | Brugada |
| New broad QRS + terminal R in aVR | "rate-related" | Sodium-channel-blocker/TCA toxicity |
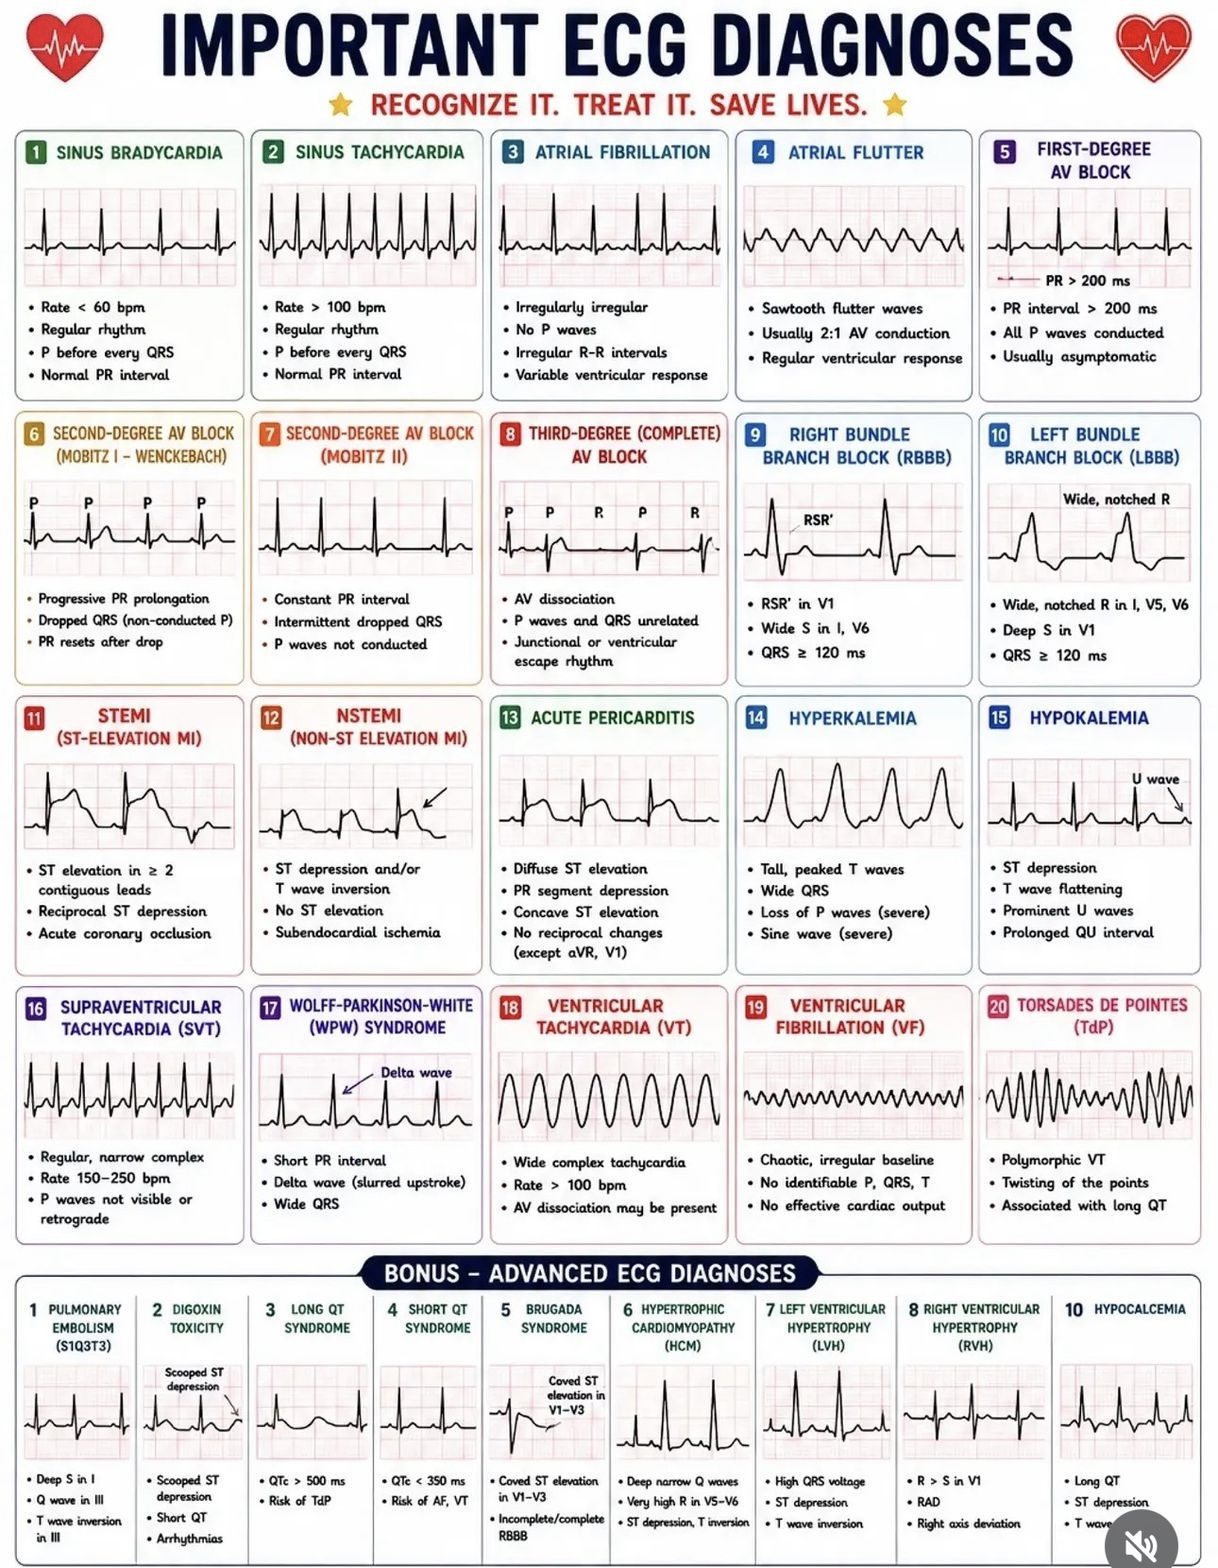
— End of The ECG Book —
Dr D Academy · An educational text. Always treat the patient, not the ECG, and confirm management against current resuscitation and cardiology guidelines.
↑ Contents